Lexi Smith
Lexi Smith worked in Atmospheric Lidar Research Group from May 2015 through May 2017. She completed her BS degree in Environmental Science with an emphasis in Applied Ecology and then attended the Yale School of the Environment where she completed an M.S. in Environmental Science in 2019.
Summer 2015 Project #1: How-To Web Page Construction
My main project for this summer was to create a web page that acts as a how-to manual for all of the processes that the Lidar Research Group uses with the lidar BSCANS. This how-to manual has an index located at http://lidar.csuchico.edu/How_To/, which includes links to other pages with instructions for the different processes. These processes will include:
- How to make PPI, RHI,
and stare images (filtered and unfiltered) from BSCAN files:
- in IDL (PS, EPS, or RASTER format)
- in Python
- How to make PPI and RHI image series (e.g., process all BSCAN files from one day and make hundreds of frames)
- How to encode PPI and RHI image series into time-lapse animations
- How to run Gale and Typhoon to make NetCDF files containing vector flow fields
- How to use NetCDF files containing vector fields:
- how to overlay them on images of backscatter intensity, in IDL and Python (white vectors over copper images)
- how to make streamlines/pathlines, and time-lapse animations of flows
Summer 2015 Project #2: Convective Boundary Layer Work
My second project for the summer was to work on convective boundary layer top and depth identification. This involves making images from lidar BSCAN files, putting those images together into time-lapses, and using programming to quantitatively identify the tops of convective boundary layers.
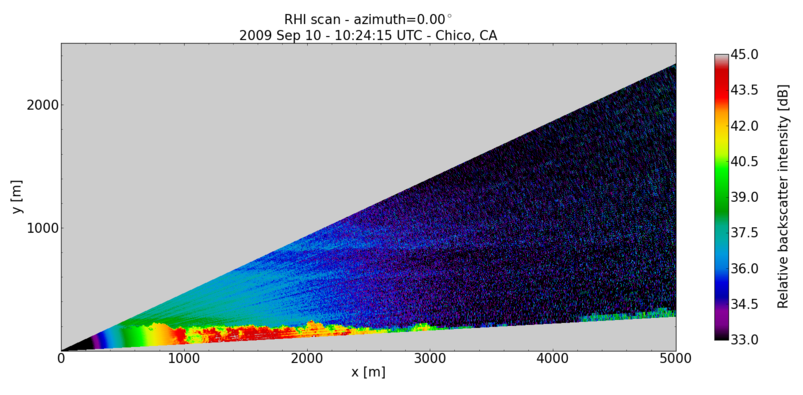
My first attempt at creating an MP4 from convective boundary layer BSCAN images:
A frame from the beginning of the video, highlighting how the convective boundary layer is quite shallow at the beginning of the day:
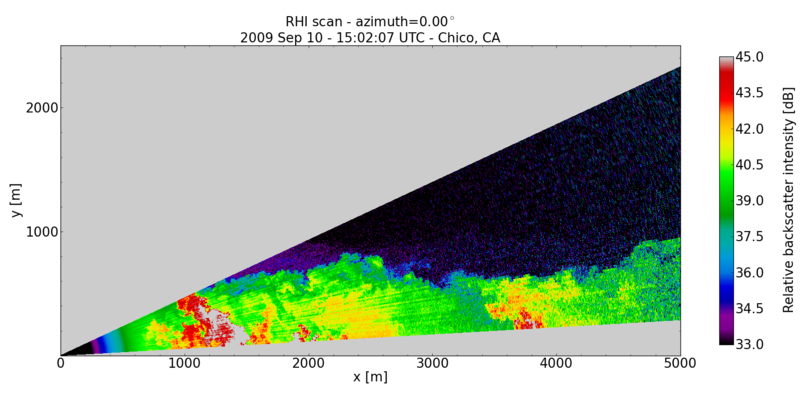
A frame from the middle of the video, highlighting how the convective boundary layer is deepest during mid-day:
A frame from the end of the video, demonstrating the stably stratified atmposphere typical during the night:
Winter Project (2015-2016): Canopy Waves Research
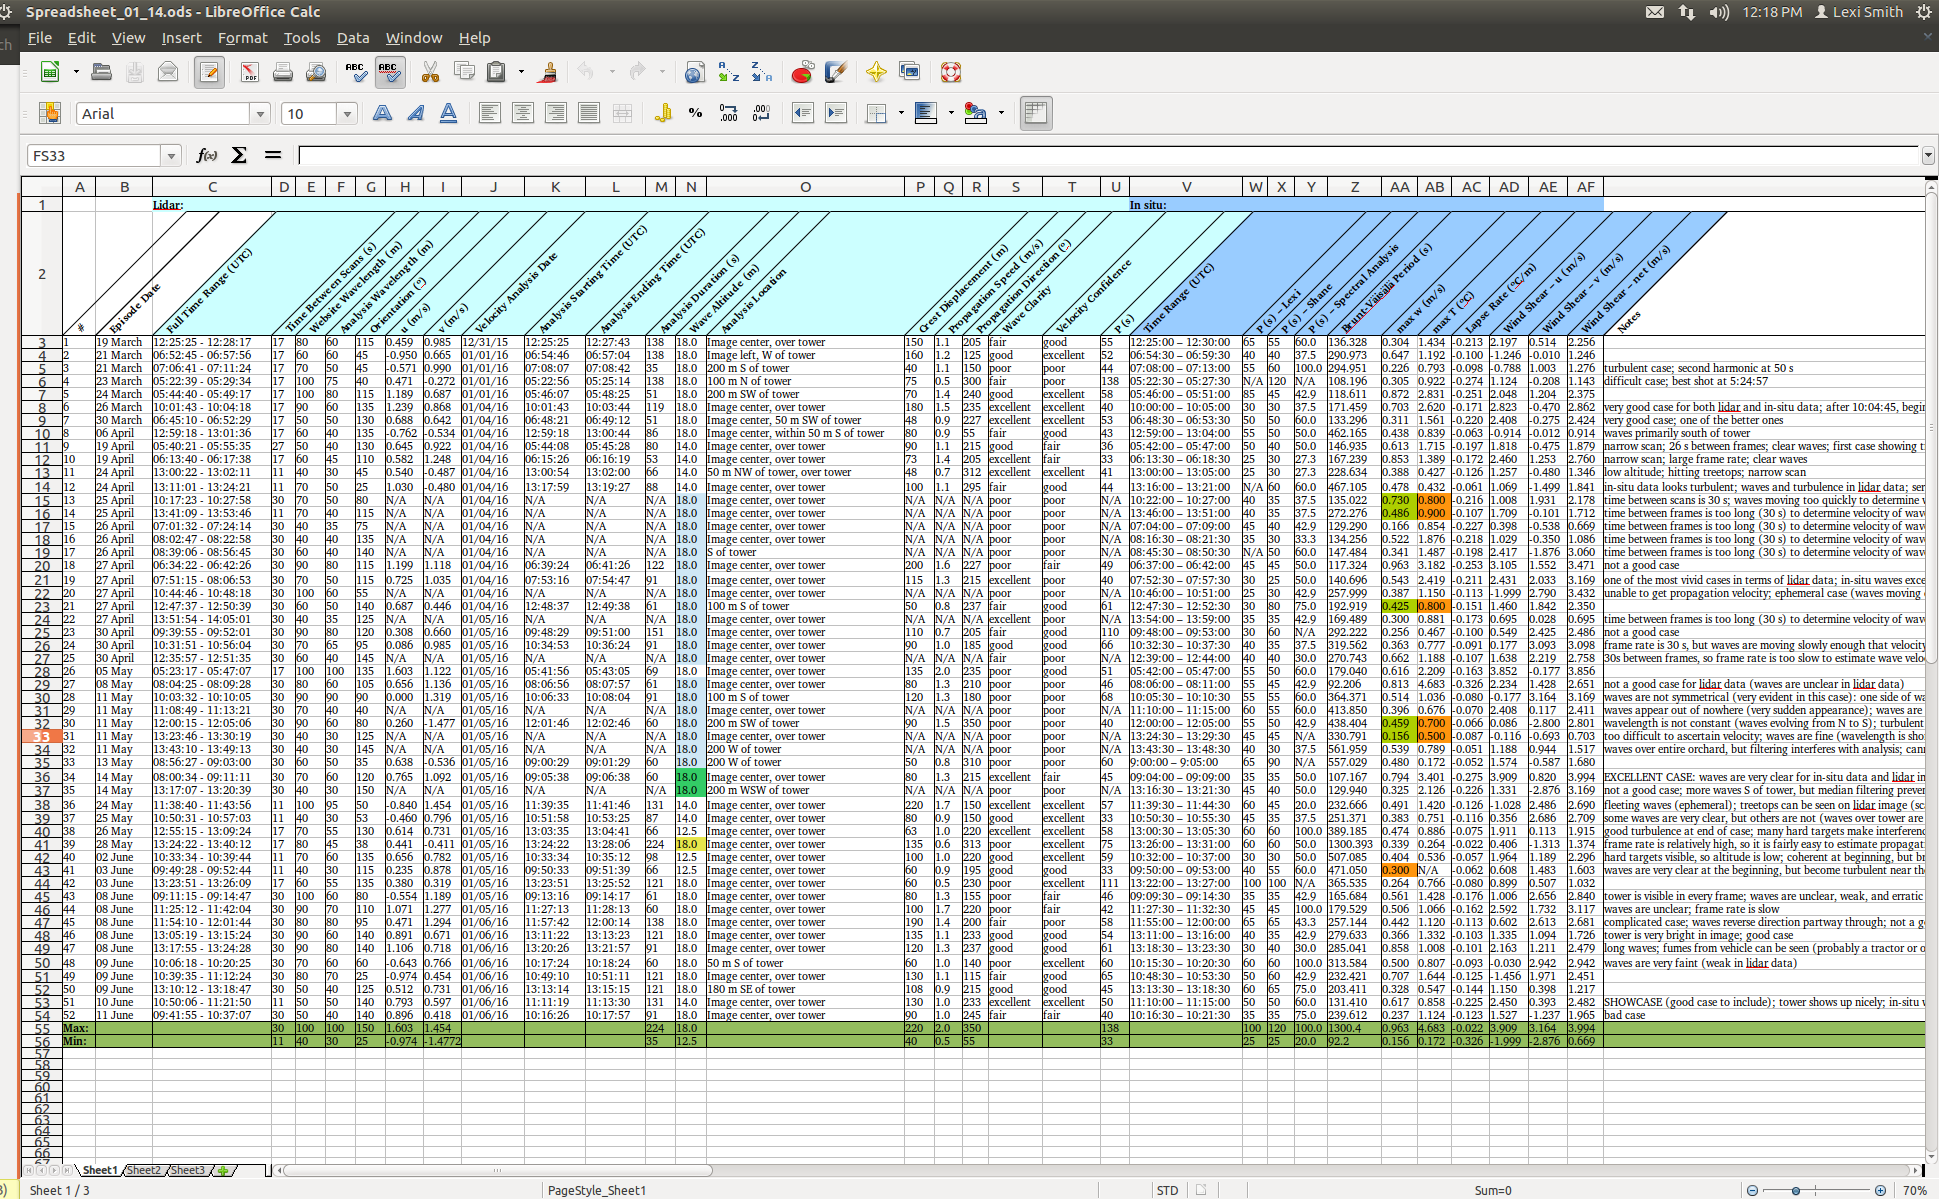
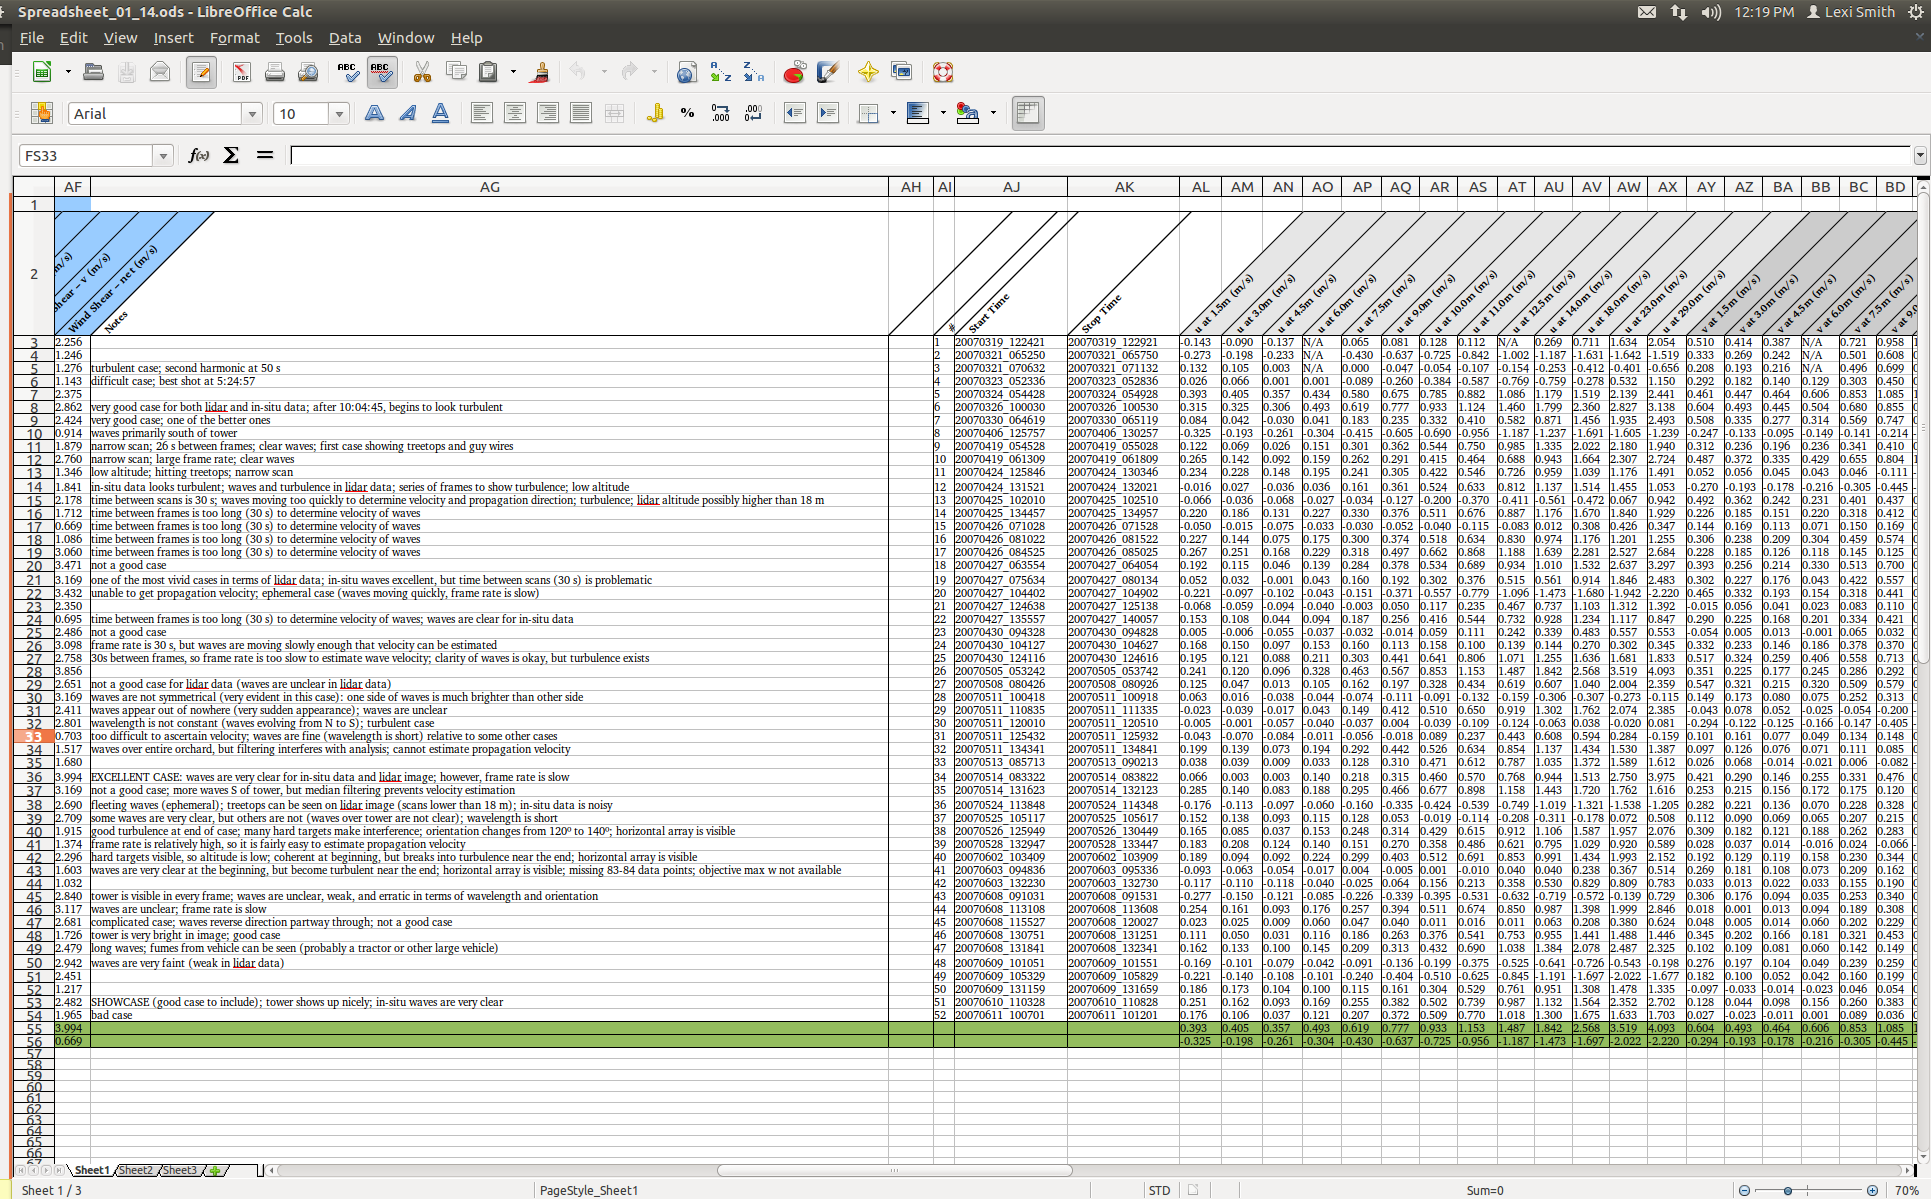
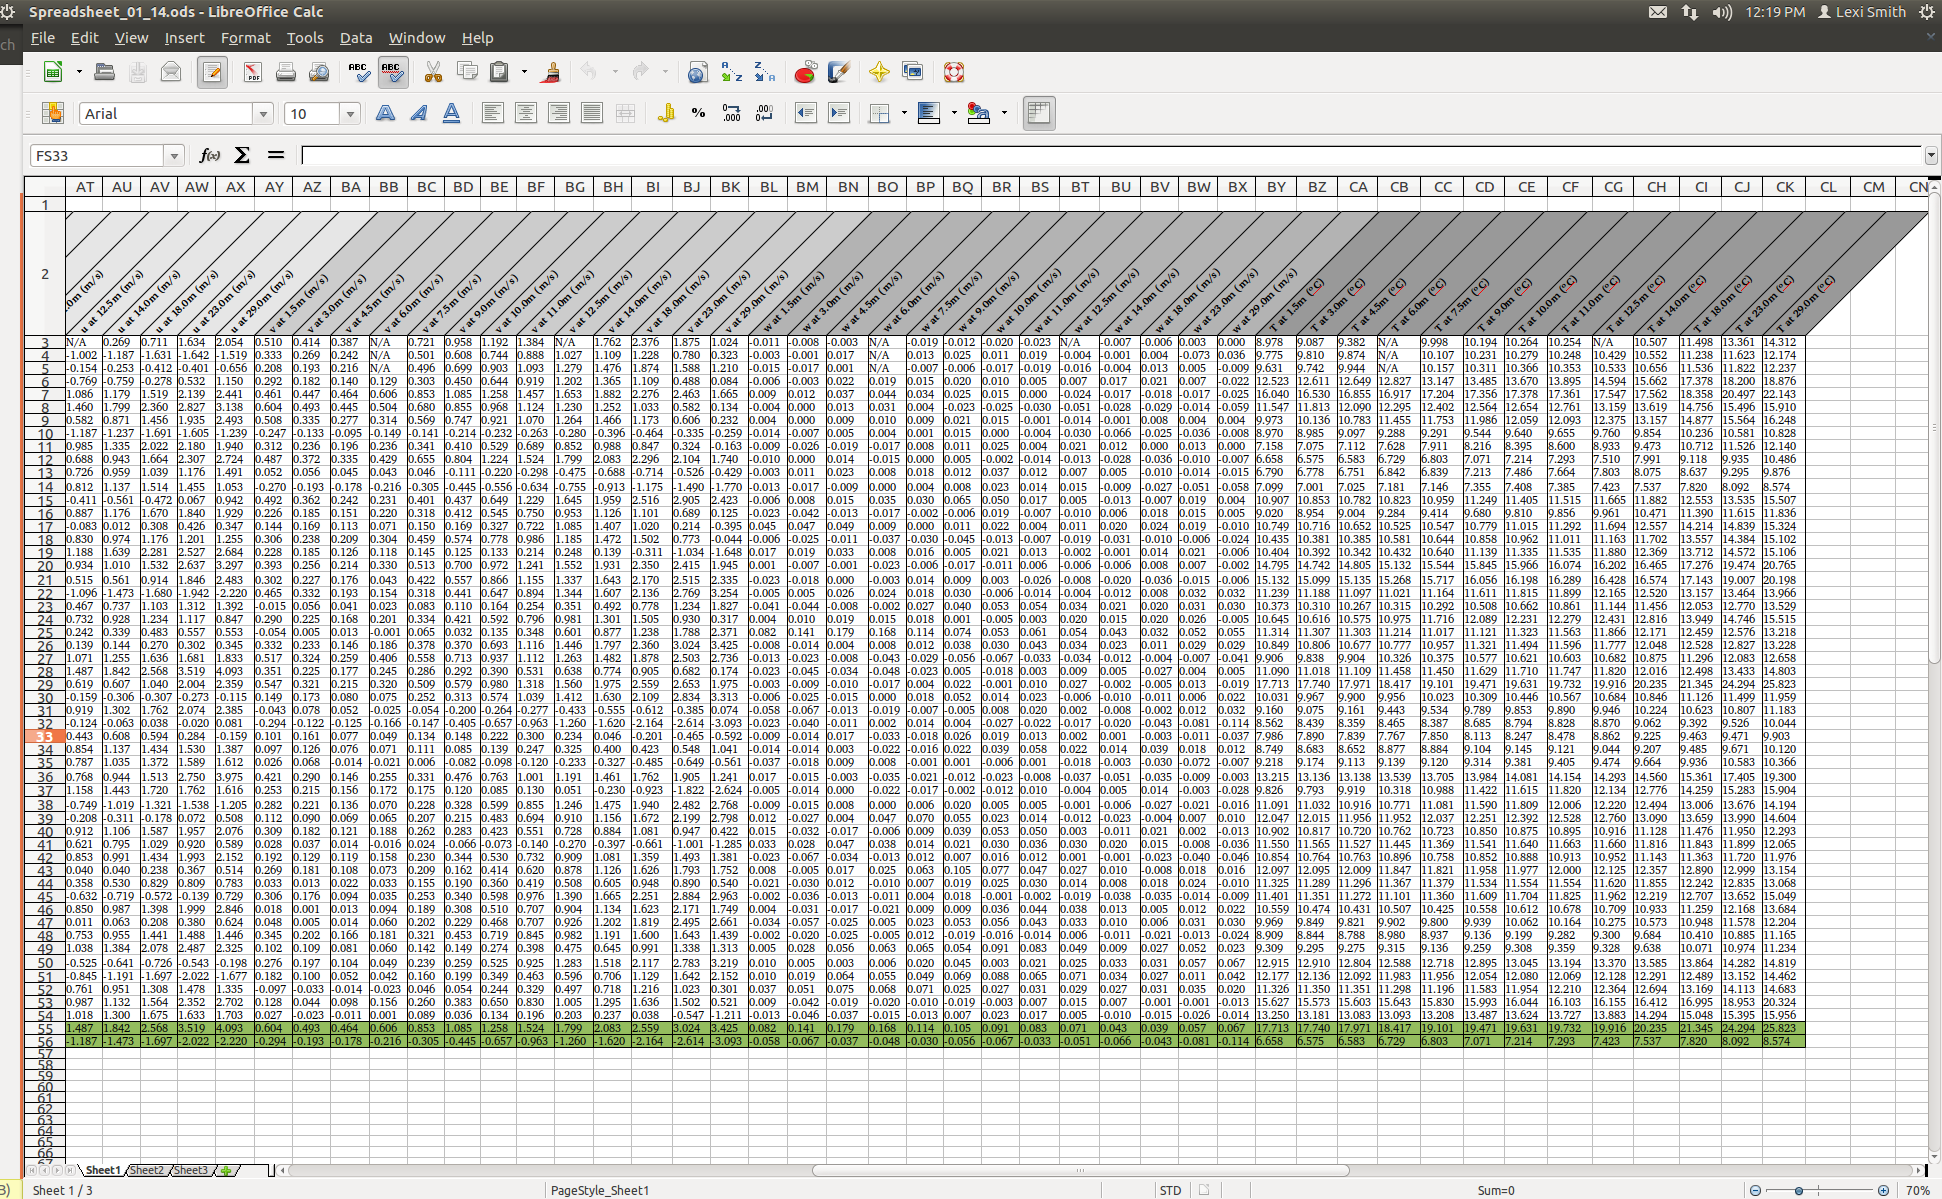
My main project for this winter was to assist with research on canopy waves. This included making a spreadsheet in LibreOffice Calc with canopy wave data, which I helped to retrieve and analyze. Part of the analysis was making graphs of different variables to find relationships and patterns. I also created a table in LaTeX for the research paper currently in progress. Finally, I created images of canopy waves and updated data on the Lidar Group website.
I created this spreadsheet with LibreOffice Calc to assist with collecting, organizing, and analyzing canopy wave data:
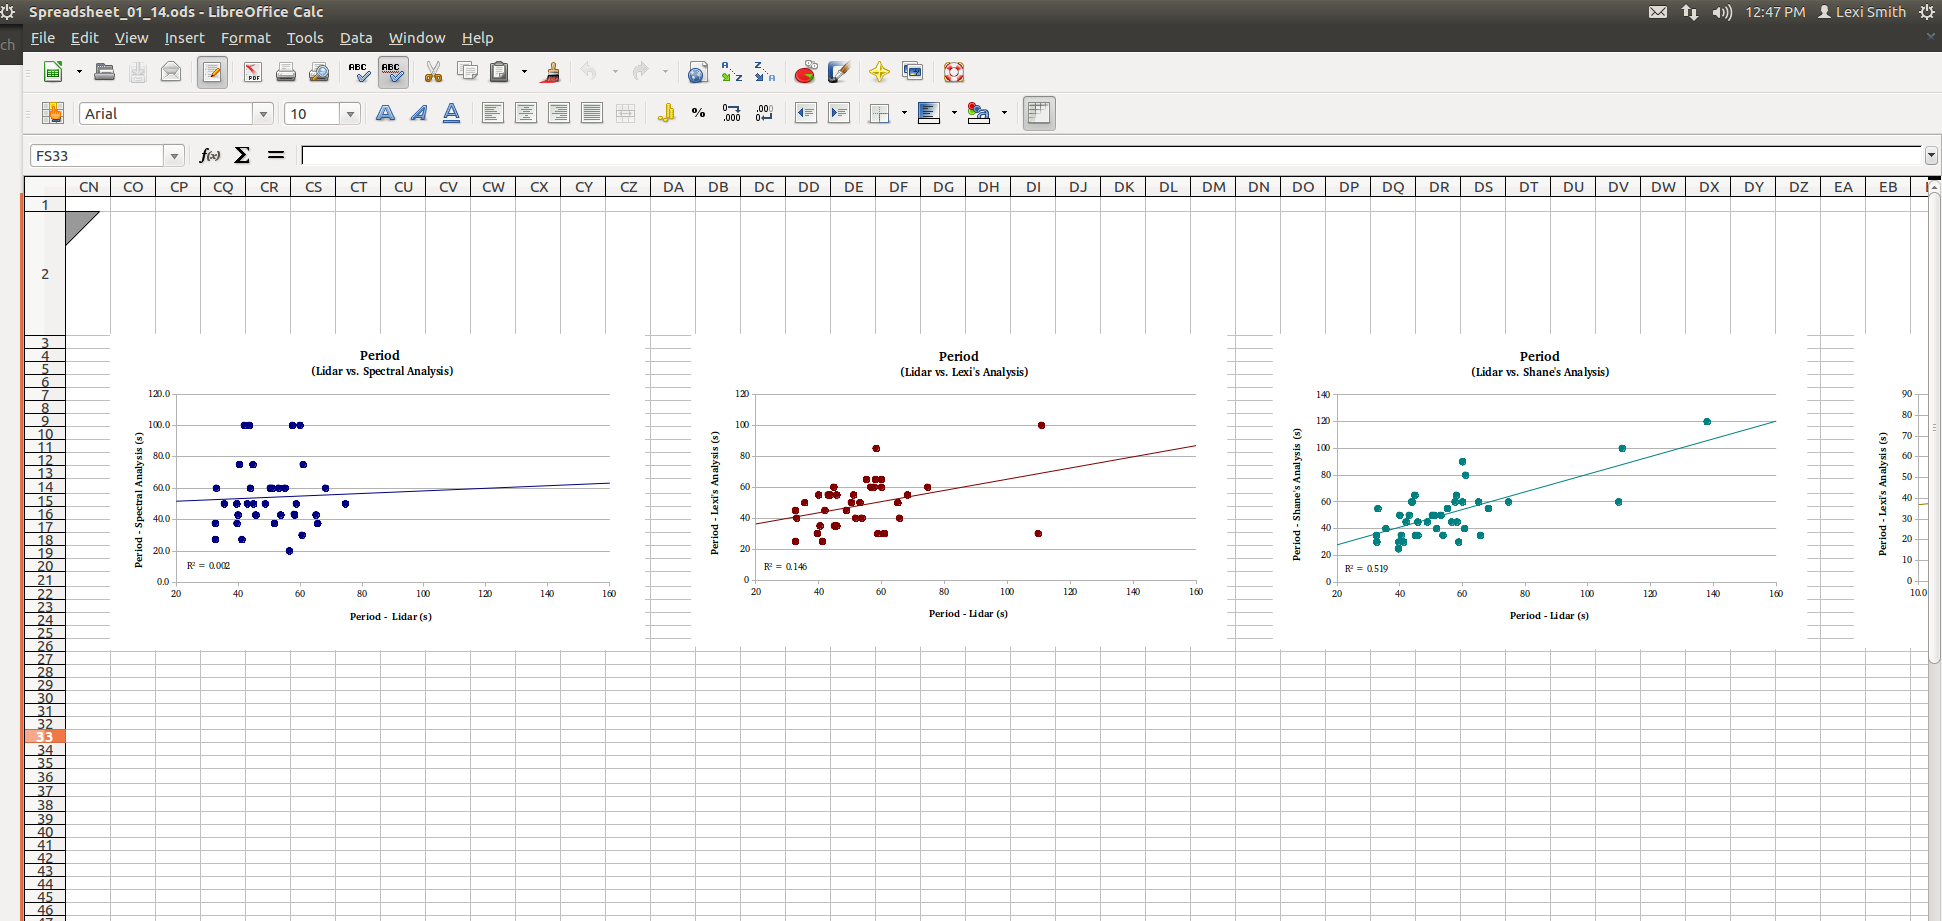
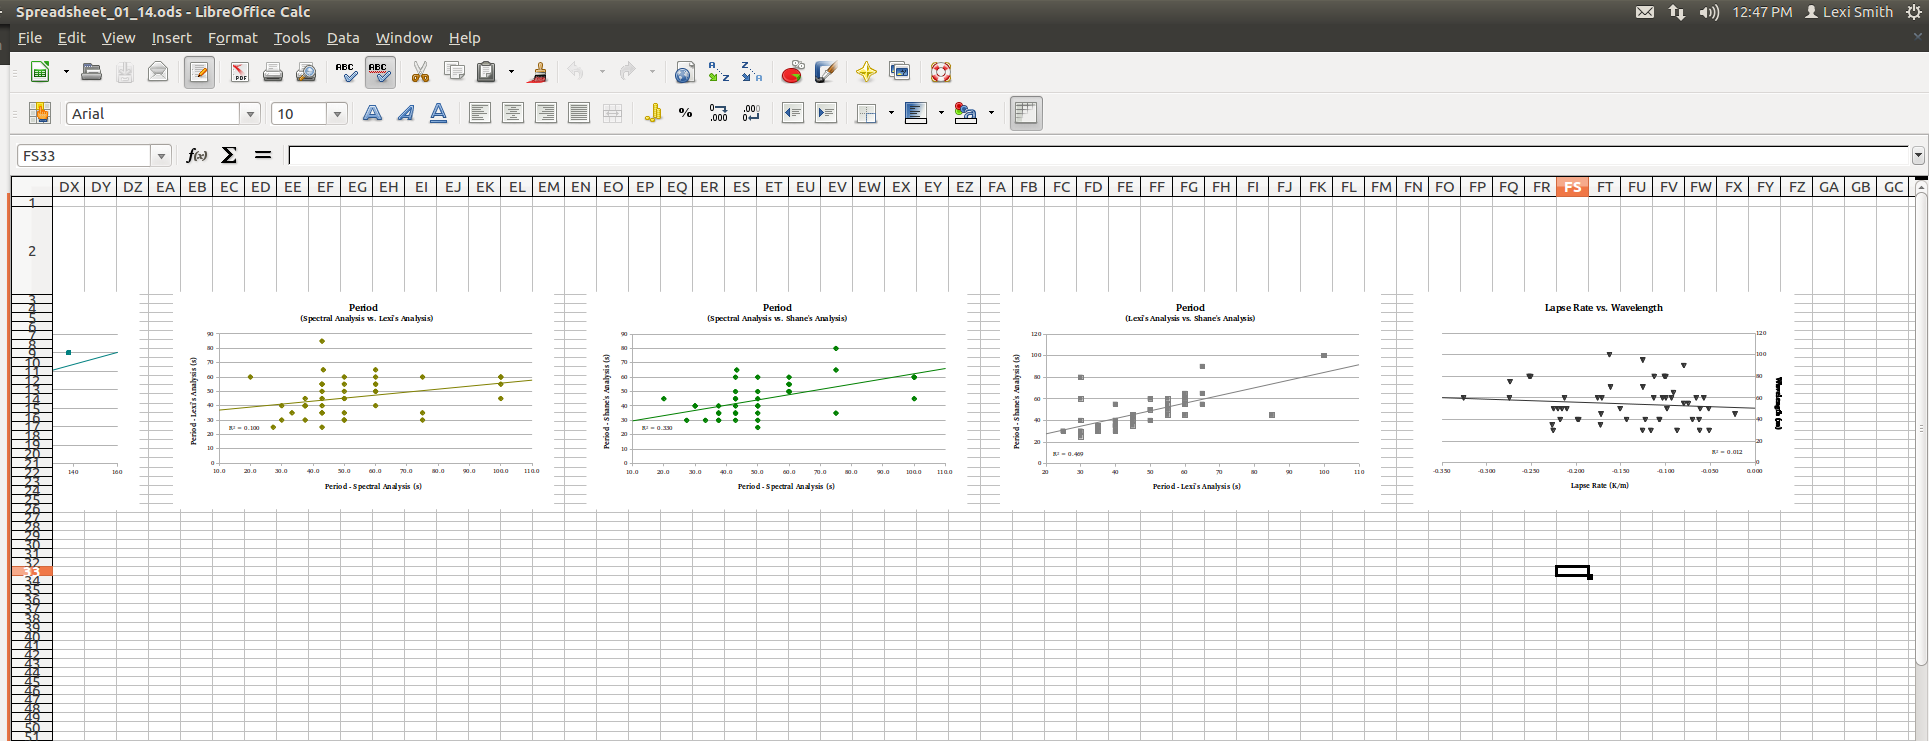
I made these graphs with LibreOffice Calc to find patterns and relationships between different variables in the spreadsheet:
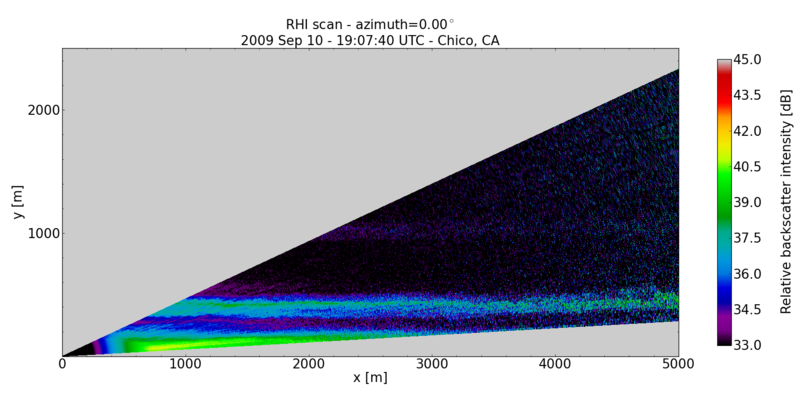
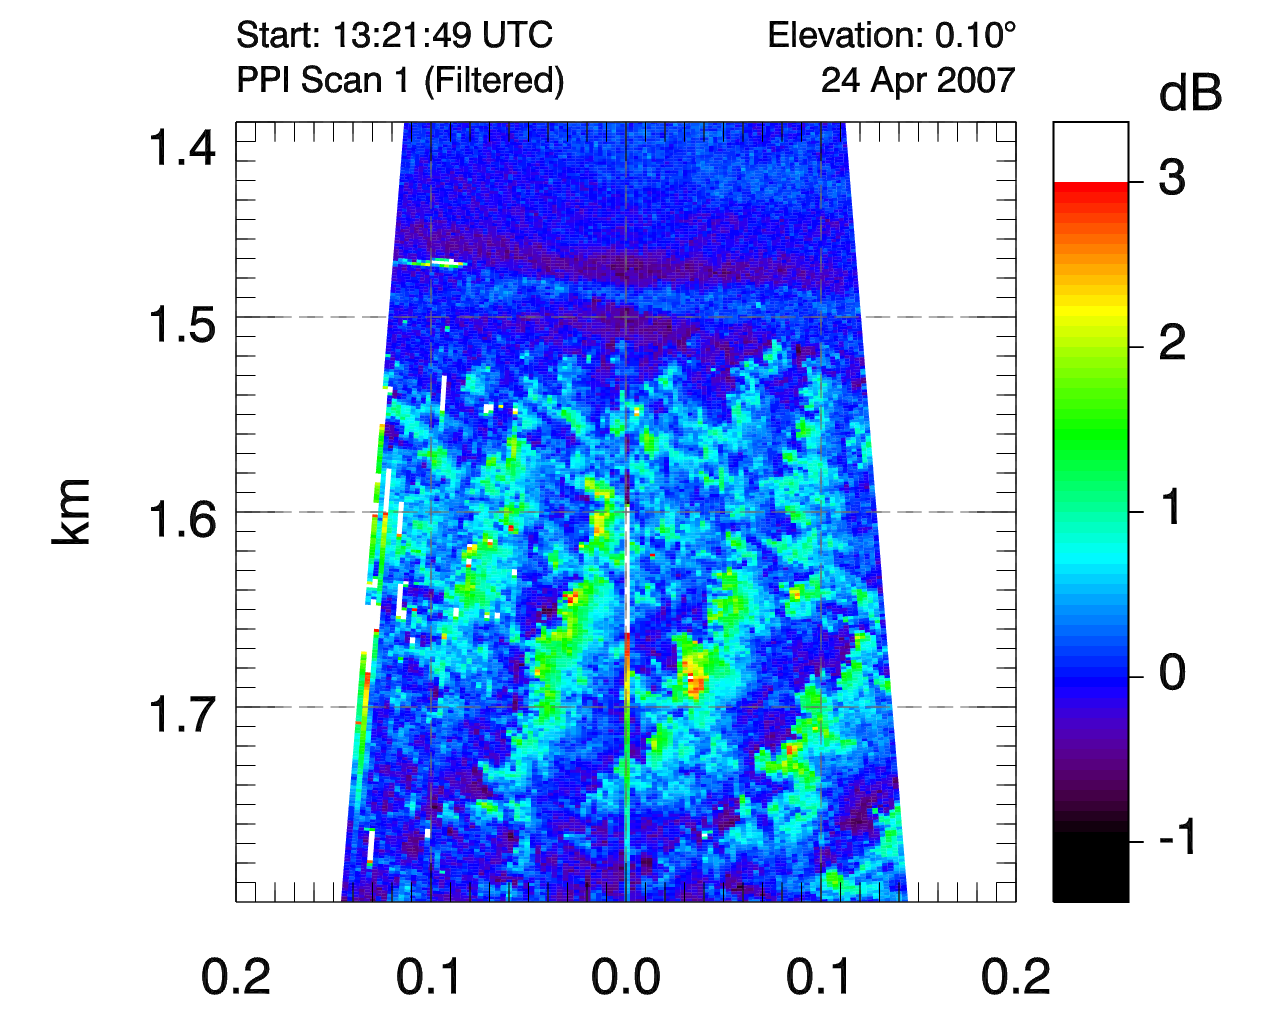
One of the canopy wave images I made using lidarGUI.pro, an IDL program created by Chris Hasek:
Summer Project (2016): Canopy Waves Research - continued
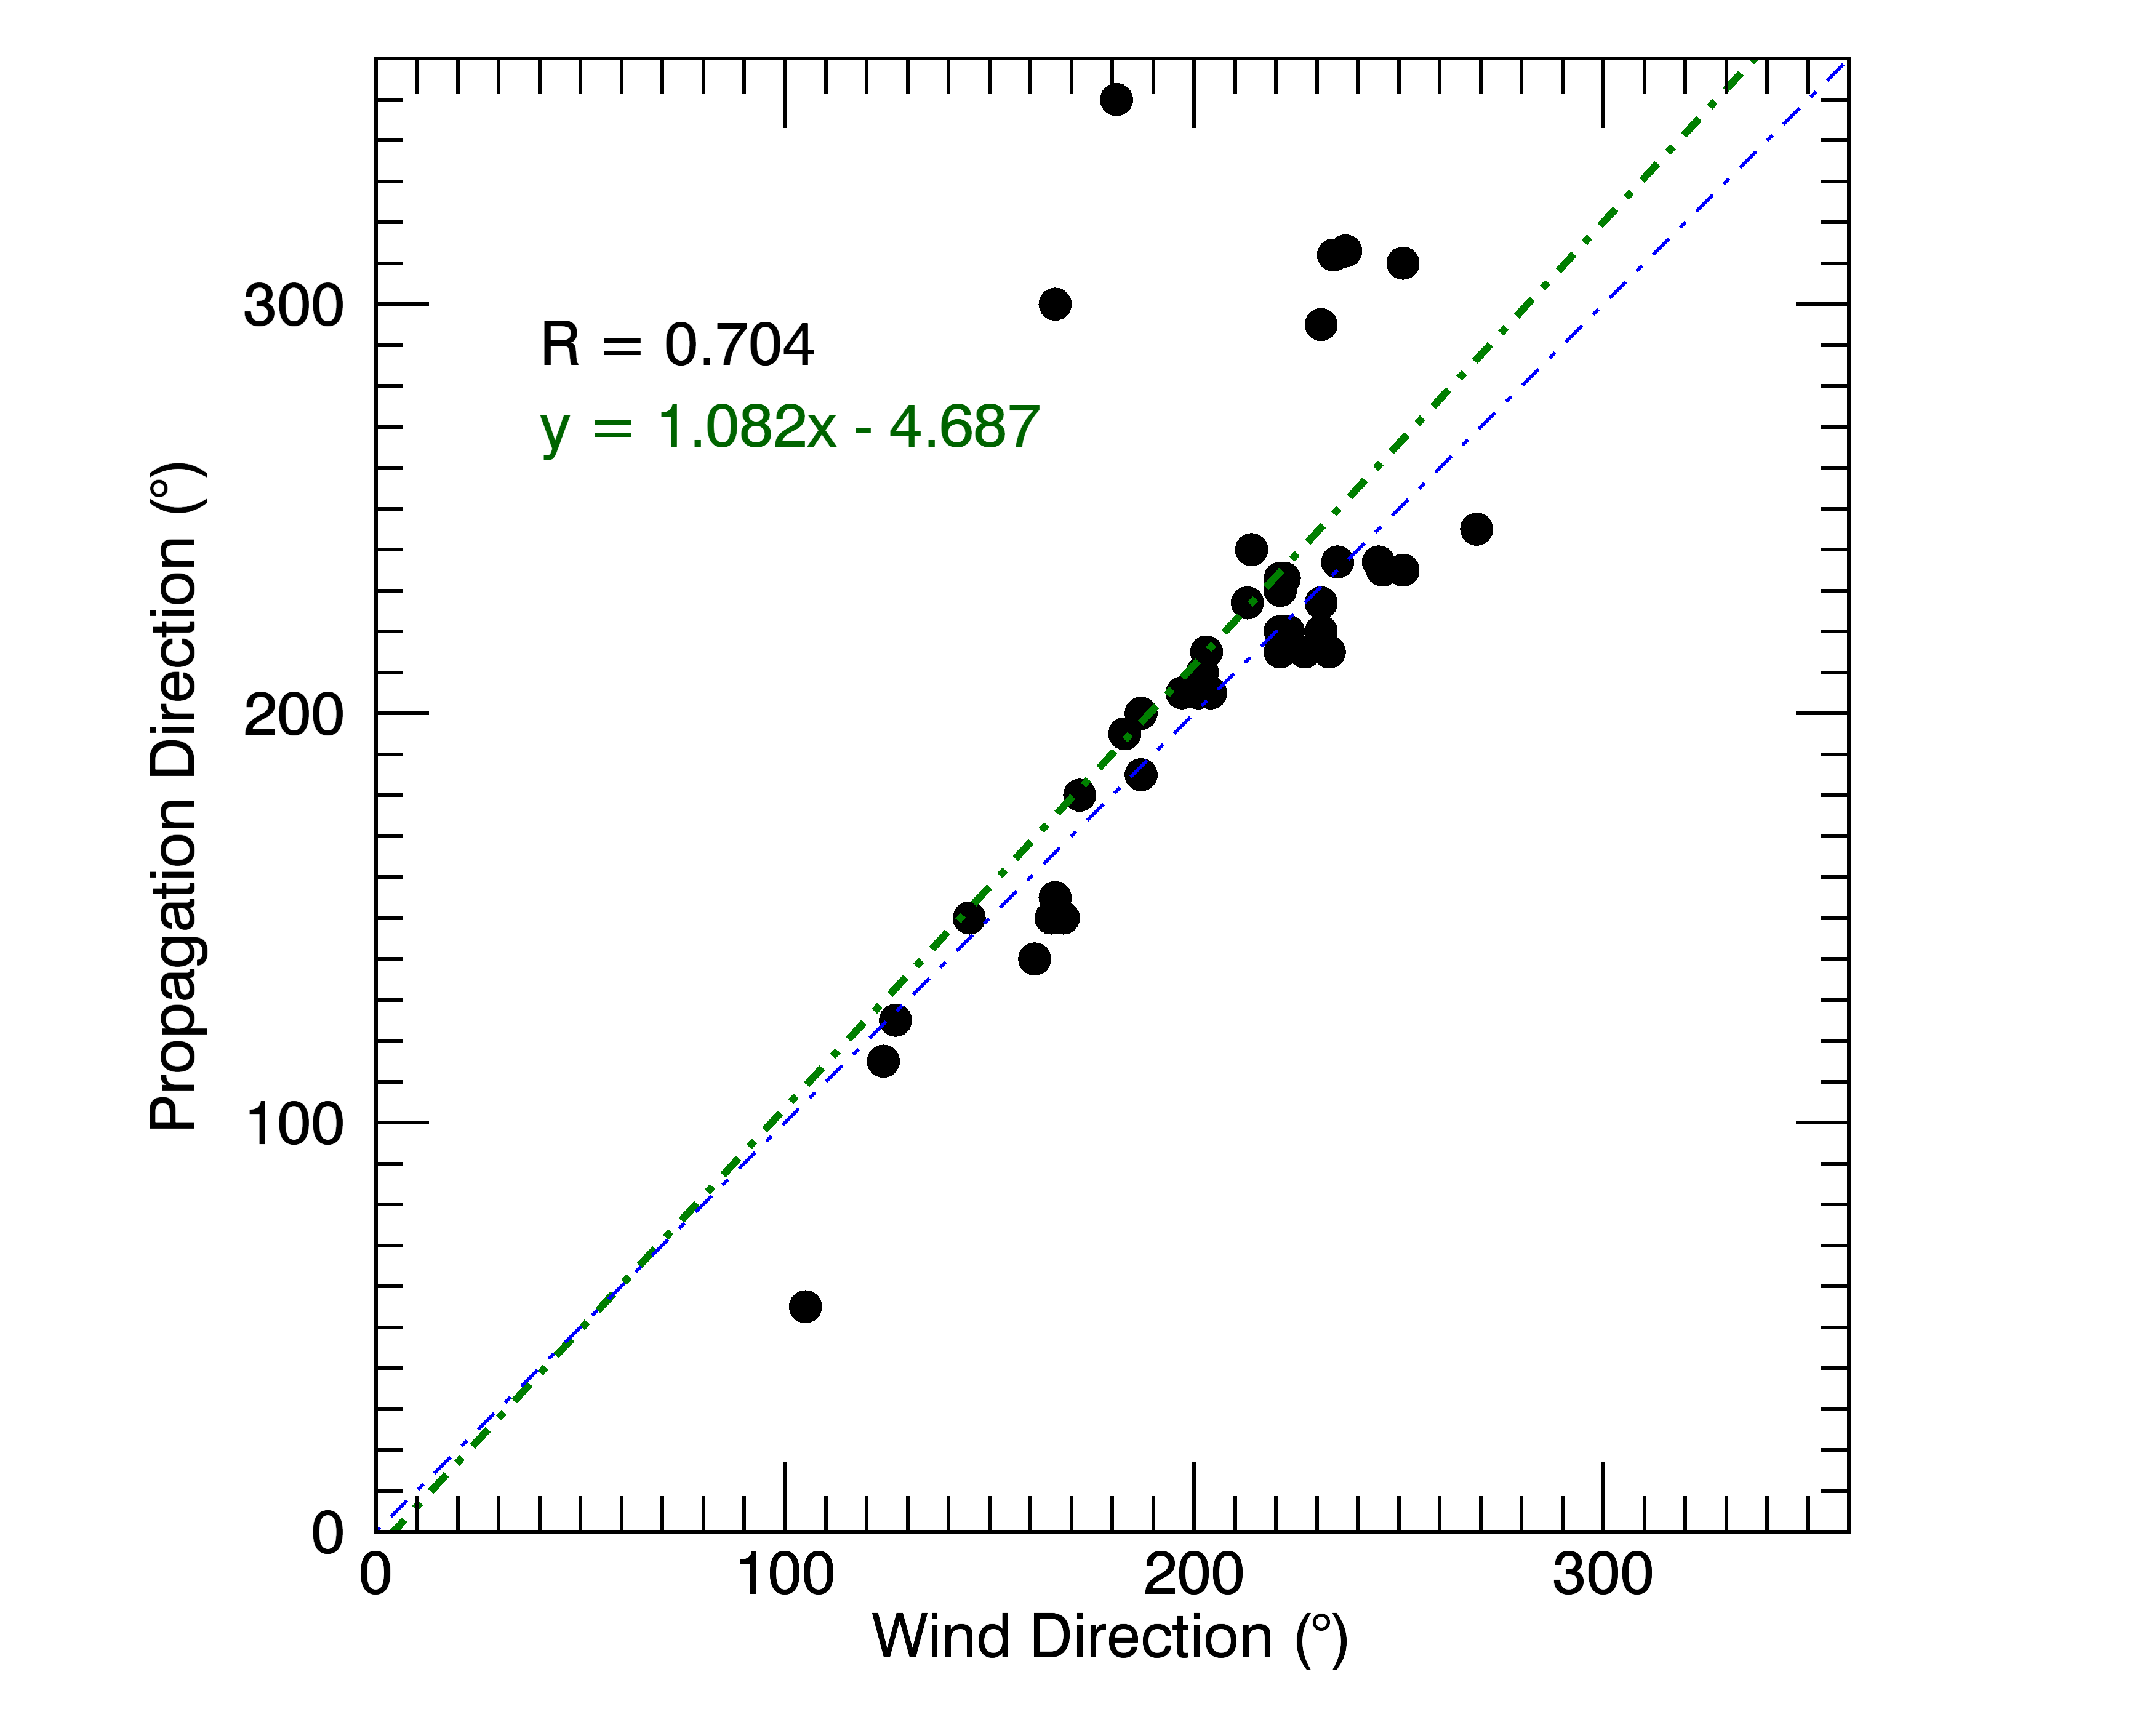
My main project for this summer is a continuation of my winter project. My work so far has been to help Dr. Mayor prepare a conference poster, conference presentation, and paper (in progress) on our canopy wave research. I have assisted with further analysis of spreadsheet data in LibreOffice Calc, as well as creation of programming, plots, and lidar images in IDL. I also used ImageMagick to create an MP4 of canopy waves with lidar images.
The IDL program I created to make figures of canopy wave data:
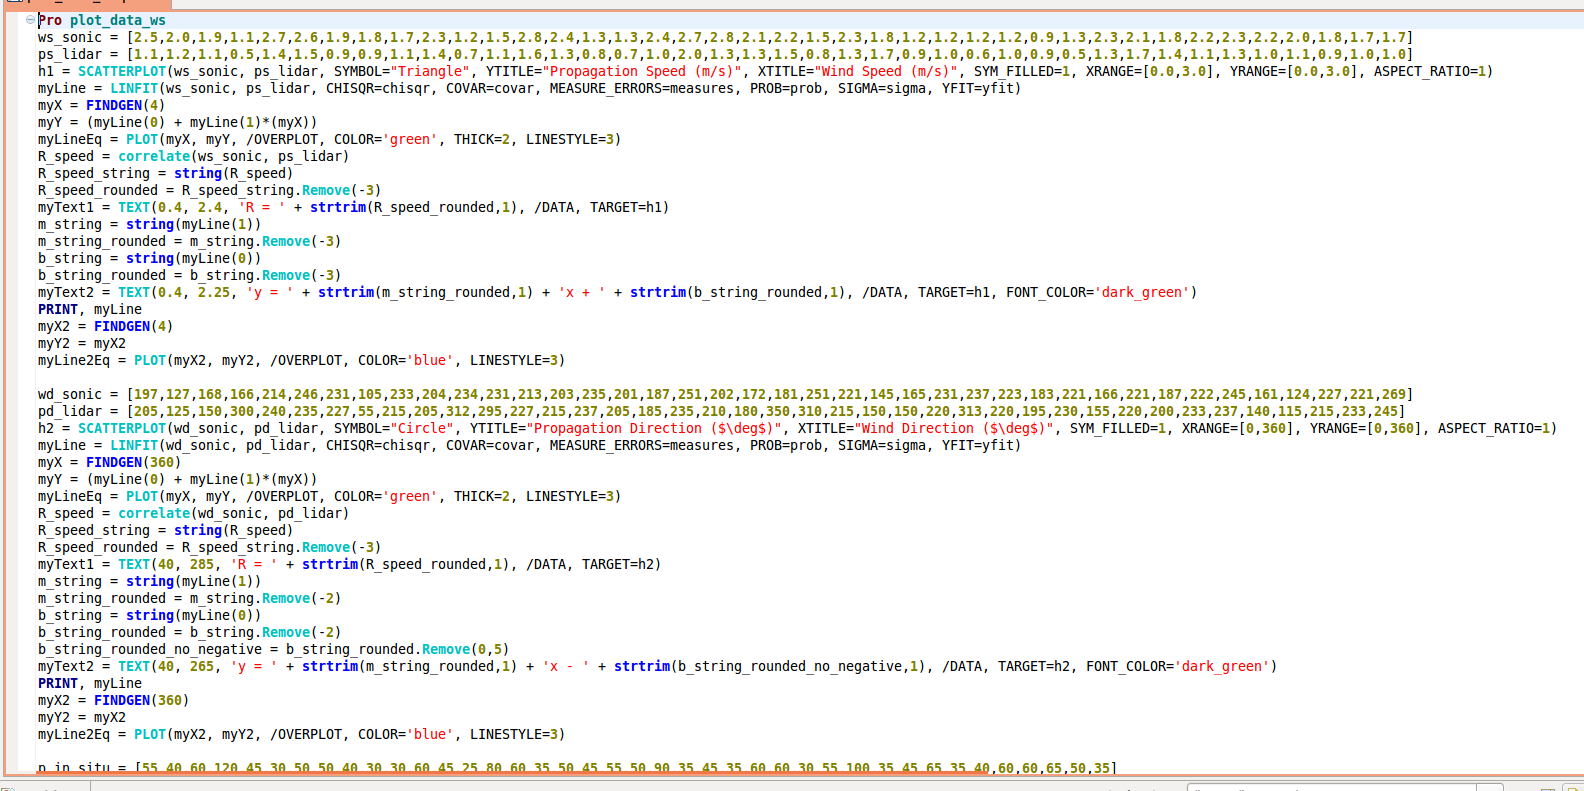
One of the figures I made using my IDL program: