Typhoon Motion Estimation Algorithm
Typhoon is a motion estimation algorithm designed to retrieve vector motion fields from image sequences of turbulent flows. It is currently being used to retrieve real-time wind fields from aerosol backscatter images provided by the REAL.
About Typhoon
Typhoon is a computer-vision algorithm; it aims at extracting the apparent displacements (motion) from image sequences. It is originally designed for fluid flows, that is to say to recover fluid velocity fields from images of fluid-flow visualizations, e.g. particle image velocimetry (PIV), schlieren photography or lidar imagery here in Chico.
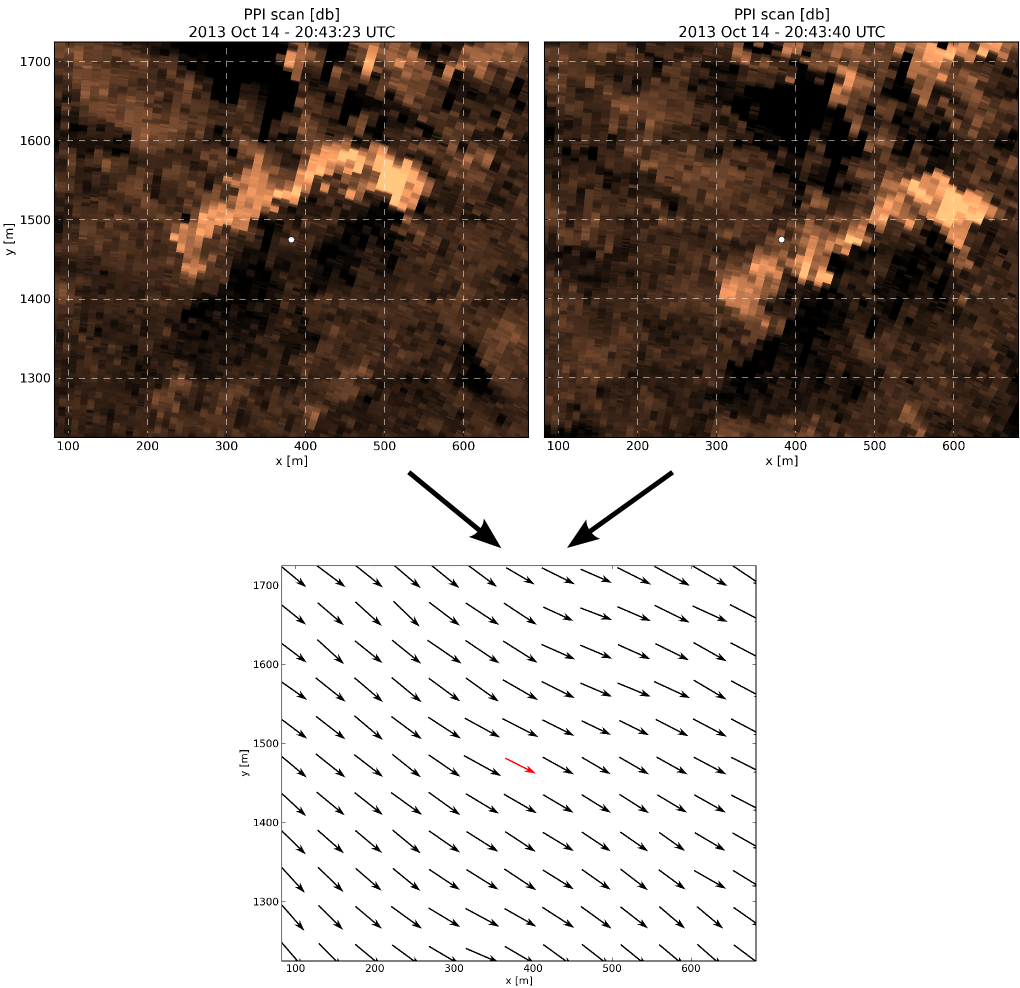
The following figure illustrates the motion estimation process. On top are subsets of two scans taken October 14, 2013 by the REAL in Chico. Displayed area is a close-up centered on the Doppler lidar (white marker at x=385, y=1472 m) used for validation (see also Validation section). The copper shading indicates the intensity, in dB, of aerosol backscatter. A large aerosol feature (brighter colors) is seen moving to the ESE and passes over the Doppler. Below is the velocity field estimated by Typhoon (black arrows) from these two images; it was decimated by a factor of 6 along both dimensions for the sake of visualization. Measurement from the Doppler lidar (red arrow, center) at 100 m above ground level (AGL) shows a good agreement with estimates.
The algorithm was first designed during the PhD thesis[1] of Pierre Dérian
within the Fluminance team of INRIA Rennes, France.
Its development is currently pursued by Pierre Dérian and Christopher Mauzey at the Atmospheric Lidar Research Group of California State University (CSU), Chico, USA.
The software and its source code are registred by the French Agency for the Protection of Programs (APP), and licensing is handled by the CSU Research Foundation.
Feel free to contact Pierre Dérian or Shane Mayor for more information.
[top]
Specs
Typhoon belongs to the class of dense optical-flow algorithms. It provides a two-component displacement vector at every grid point (image pixel), contrary to the well-known cross-correlation algorithm which usually provides sparse motion fields. Typhoon's main particularity is that it relies on a wavelet representation of the motion field, which brings a multiscale framework as well as interesting regularity properties.
The original software is written in C++. In Chico, we have achieved the parallelization of low-level functions in CUDA, which allows to execute code on compatible NVIDIA's graphic processing units (GPUs). The CUDA version of the software achieves a speed gain of 10 to 100 with respect to the CPU version[2], which makes it very interesting for large images. The code has been tested on Ubuntu 12.04 and OSX 10.7--9. A Windows version is theoretically possible, but not scheduled so far.
Some of the features of (cu)Typhoon:
- Relies on the CImg library and Imagemagick/convert for image input/output, which accept a wide range of image formats;
- (cu)Tsunami, a custom wavelet library containing both CPU and GPU-accelerated routines;
- A "server" version for custom I/O, preprocessing, ....
[top]
Examples
This section presents a few visualizations of wind field estimated by Typhoon.
Please refer to the Youtube video legend - (i) icon top-right of the video - for detailed descriptions.
HD movie (h264/mp4, 30 MB) can be downloaded here.
HD movie (h264/mp4, 92MB) can be downloaded here
HD movie (h264/mp4, 105MB) can be downloaded here
HD movie (h264/mp4, 60MB) can be downloaded here
More examples available on Pierre Dérian project and Lagrangian visualization pages.
[top]
Validation
The first version of Typhoon has been extensively tested and validated on both synthetic and actual particle (PIV) and scalar dispersion images[1][3], as well as satellite imagery[4]. Schlieren photography, IR imagery, water vapor imagery have shown promising results as well (unpublished).
Regarding lidar imagery and wind estimation, the huge amount of data collected during the Chico 2013 experiment is still being processed at the moment. Early results indicate a good agreement with the Doppler lidar measurements used for reference, in particular during day time. Validation examples presented below are work in progress and should not be considered as final results.
Chico 2013 Experiment, Temporal Validation
The Doppler lidar is located at 15° azimuth, 1500 m from the REAL and provides vertical profiles of wind velocity. This wind profile intersects the REAL scan plane at 50, 100 or 150 m AGL, depending on the elevation of the REAL (2, 4 or 6° respectively). This configuration enables temporal comparisons (time-series) of wind speed and direction at Doppler location.
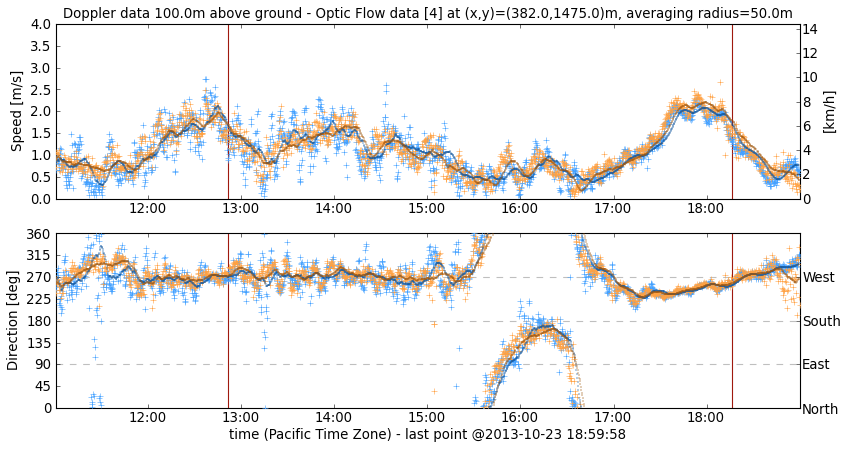
The figure below is an example of time-series of wind speed (top) and direction (bottom) as measured by the Doppler (blue) and Typhoon optical flow (orange) at 100 m AGL on October 23 2013. Markers '+' are the instantaneous measurements every 17 seconds, darker continuous lines are the 10-min rolling averages (from data preceding current point). Vertical lines denote the Sun transit (noon) and set. The change in wind direction between 15:30 and 17:00 is due to a vortex moving back and forth above Doppler location,[5] also shown in the first video above.
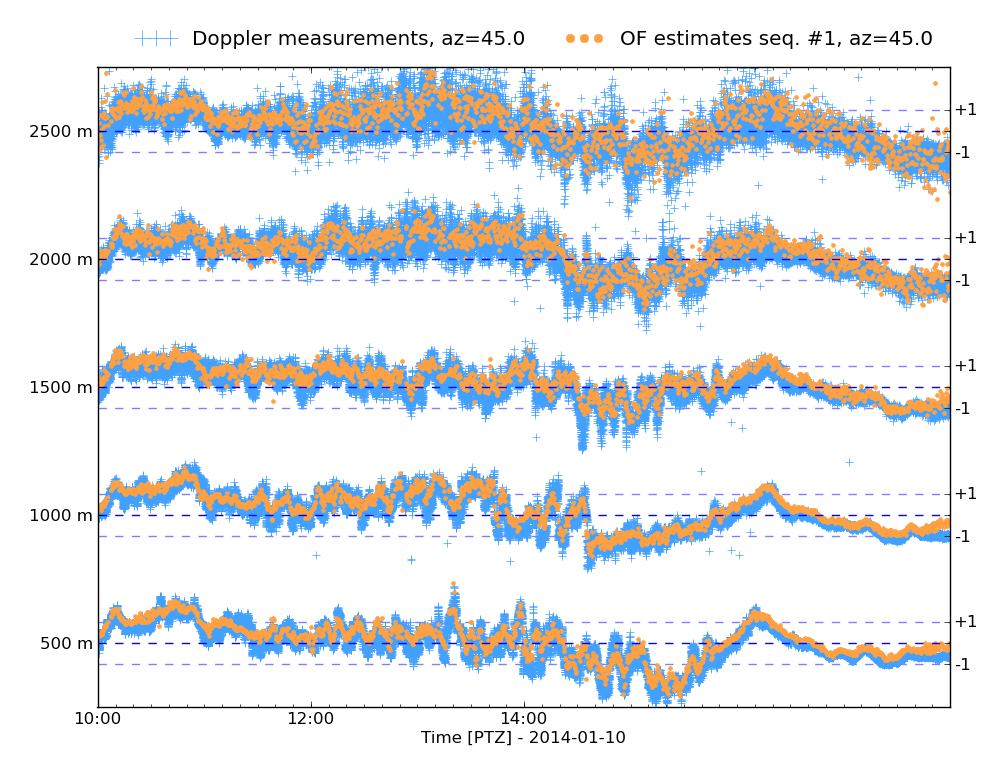
Chico 2013 Experiment, Spacial Validation
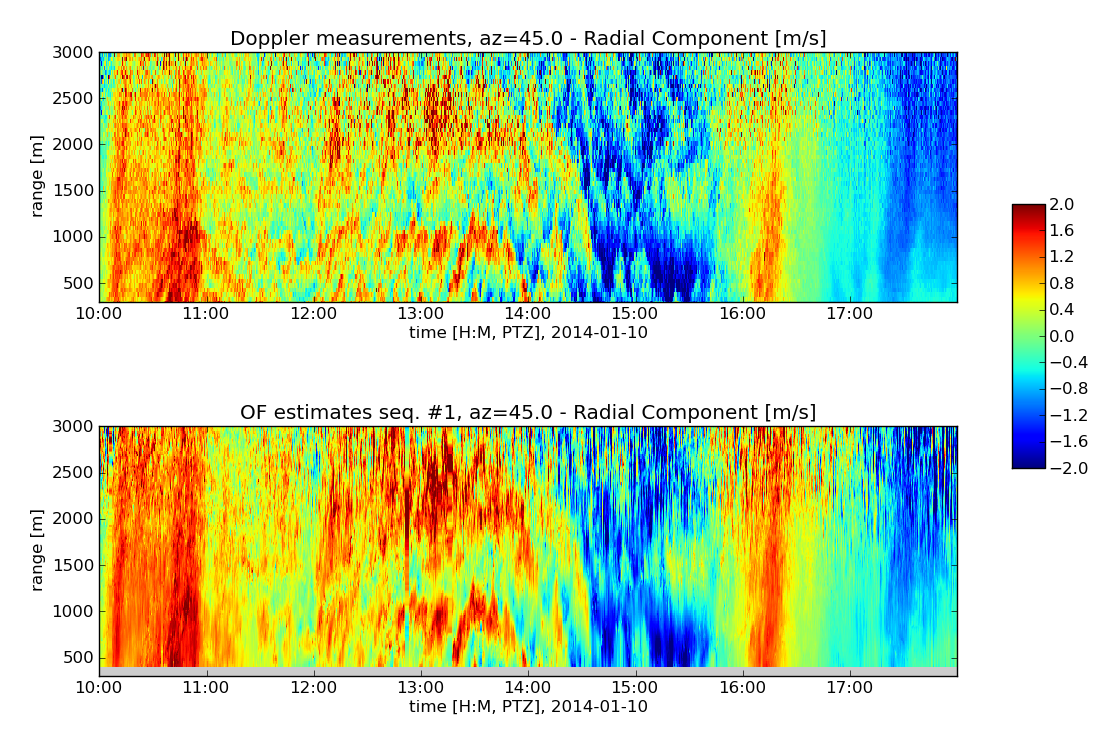
The Doppler lidar is located on the roof of the REAL and operates in scanning or staring mode, providing respectively maps (scans) or radial profile of radial wind velocity. This enables to compare spacial comparisons of radial velocity. Note that the wind estimates provided by Typhoon contain both radial and tangential components, however no reference is available for the tangential component.
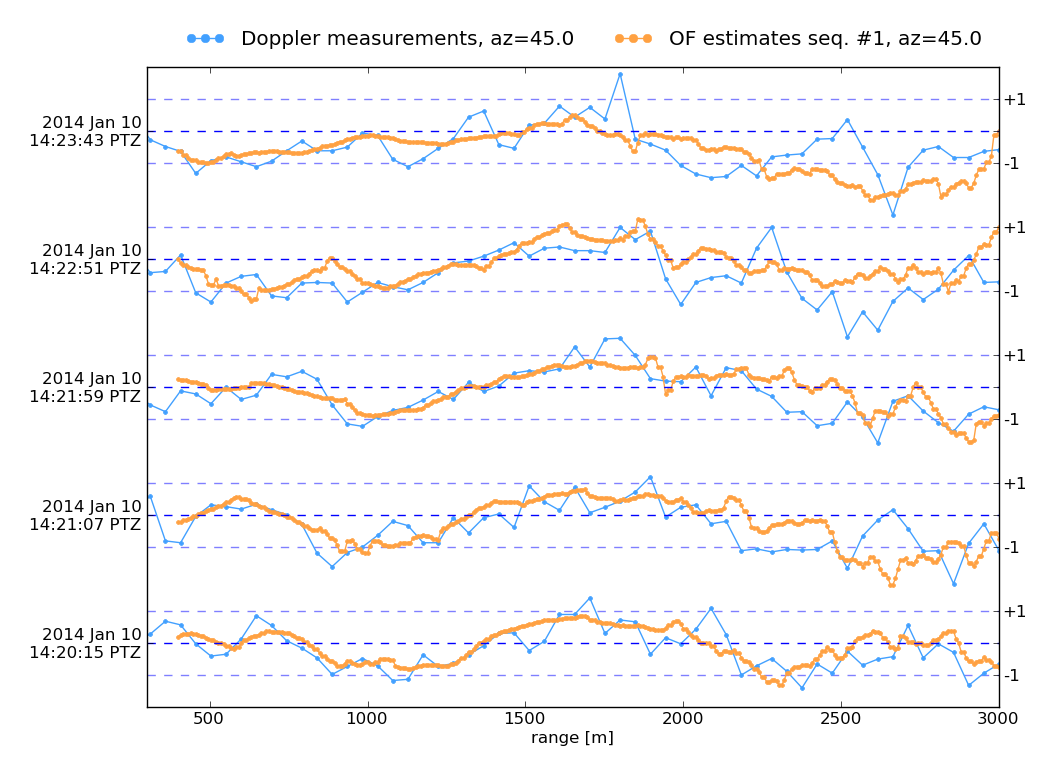
This first figure presents profiles of radial velocity as a function of range at azimuth=45°, measured by the Doppler (blue) or Typhoon optical flow (OF, orange) on January 10 2014 between 14:20 and 14:24 PTZ (showing 1 every 3 estimates).
The main wind direction is North-West (315°), so that the radial component seen at 45° azimuth is essentially turbulent fluctuations.
Doppler values are spaced every 48 m, Typhoon values every 8 m.
[top]
Related Publications
- Dérian, P., C. F. Mauzey, and S. D. Mayor, 2015: Wavelet-based optical flow for two-component wind field estimation from single aerosol lidar data. J. Atmos. Ocean. Technol., 32, 1759-1778. PDF AMS
- Dérian, P., 2012: Wavelets and Fluid Motion Estimation, Ph.D. Dissertation, University of Rennes, France. Manuscript (english).
- Mauzey, C. F., P. Dérian, and S. D. Mayor, 2014: Wavelet-based optical flow for real-time wind estimation using CUDA, poster presentation, GPU Technology Conference (GTC), 24-27 March, San Jose, CA. Poster.
- Dérian, P., P. Héas, C. Herzet and E. Mémin, 2013, Wavelets and Optical Flow Motion Estimation, Numerical Mathematics: Theory, Methods and Applications, Vol. 6, pp. 116-137. Link.
- Kadri Harouna, S., P. Dérian, P., Héas, and E. Mémin, 2013, Divergence-free Wavelets and High Order Regularization, International Journal of Computer Vision, Vol. 103, pp. 80-99. Link.
- Dérian, P., C. F. Mauzey, and S. D. Mayor, 2013: Wavelet optical flow for 2-component wind field from horizontally scanning lidar data, poster presentation A13G-0303 in Weather-Driven Renewable Energy Posters, American Geophysical Union (AGU) Fall Meeting, San Francisco, CA, 8-13 December. Poster.
- Dérian, P., C. F. Mauzey, and S. D. Mayor, 2014: Wavelet optical flow for 2-component wind fields from aerosol backscatter lidar data, poster presentation at the American Meteorological Societys 21st Symposium on Boundary Layers and Turbulence, 9-13 June, Leeds, UK. Link | Poster. You may also visit the dedicated Publications page.
[top]