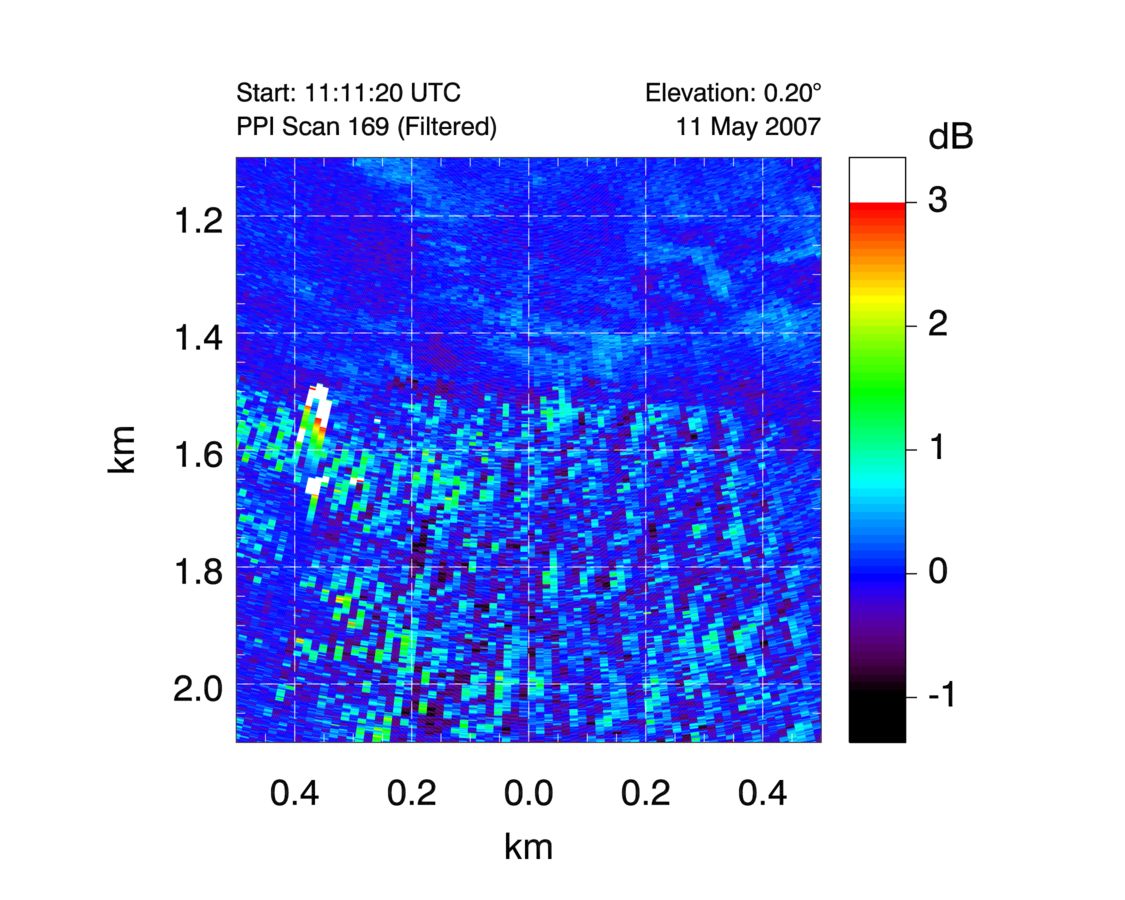
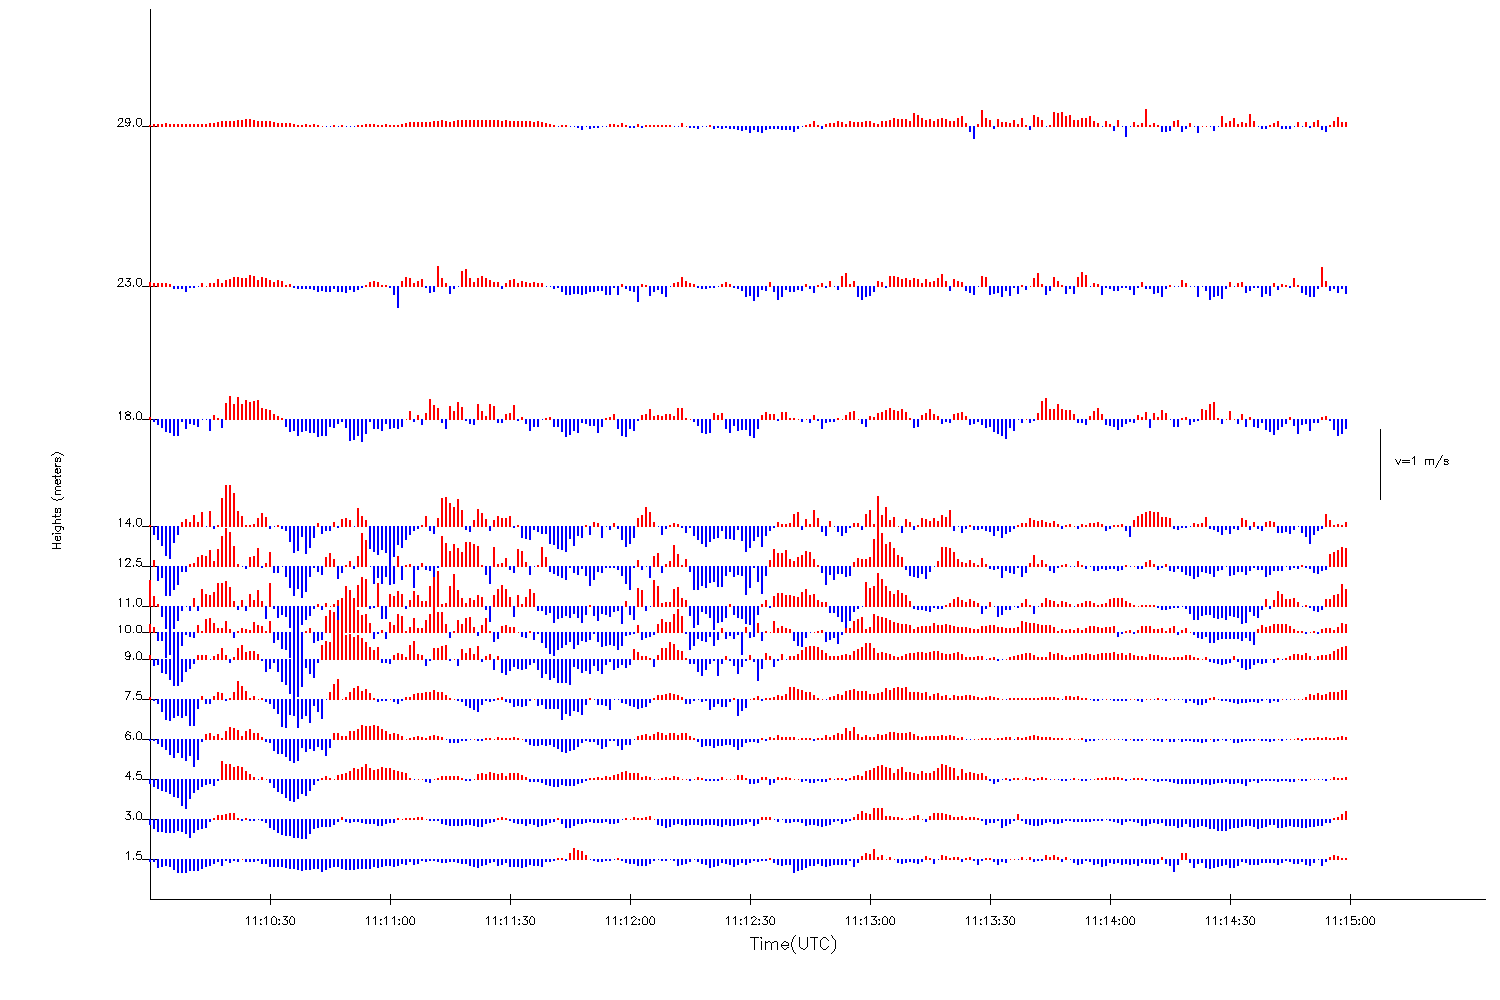
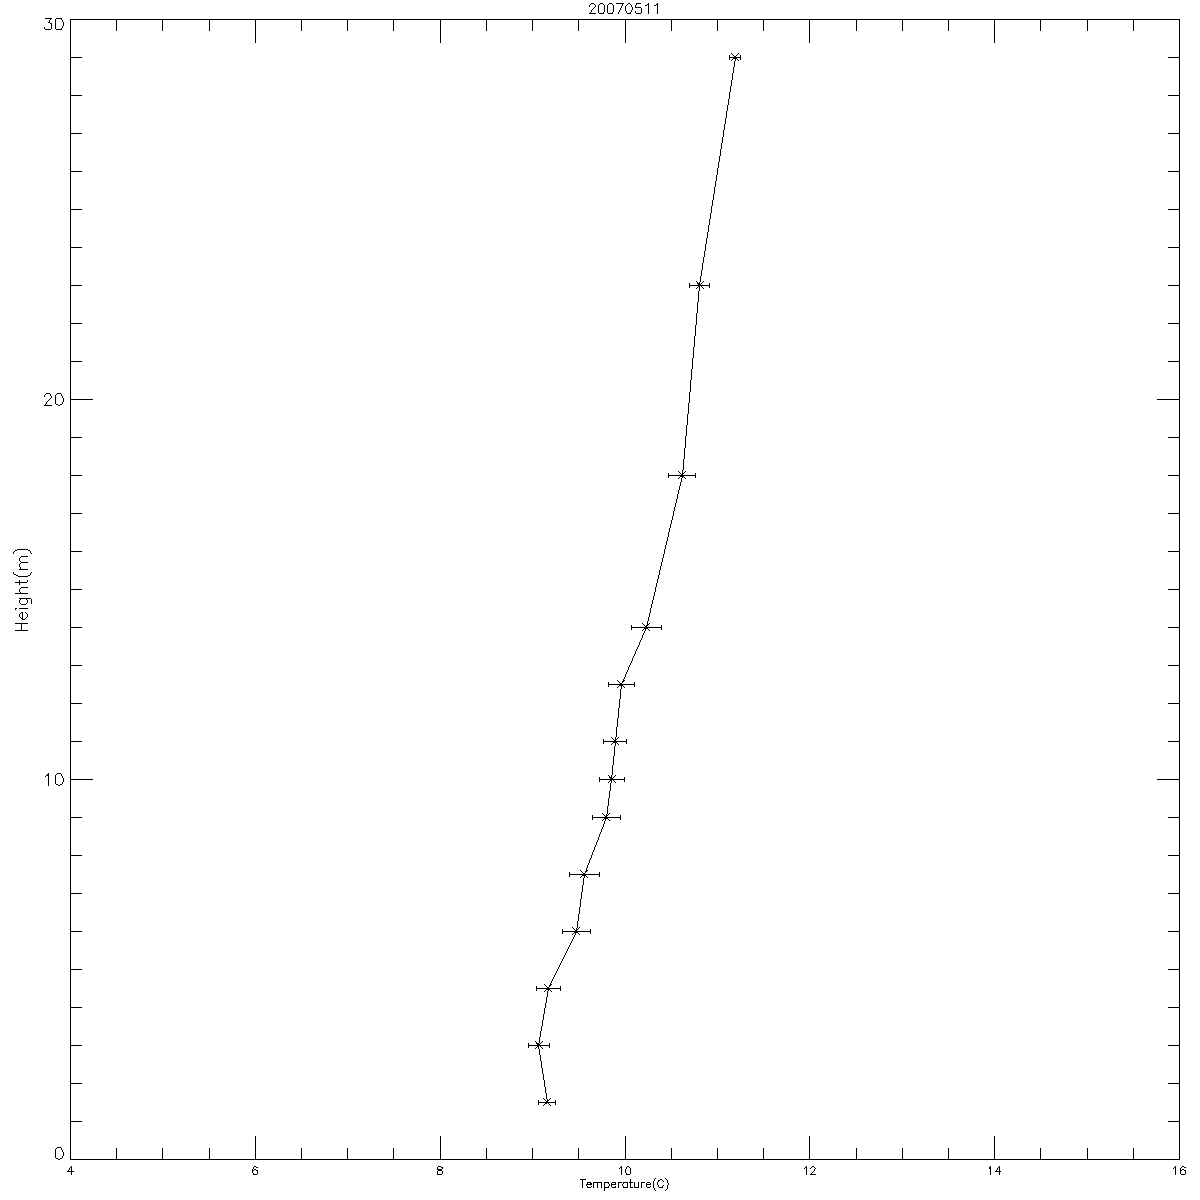
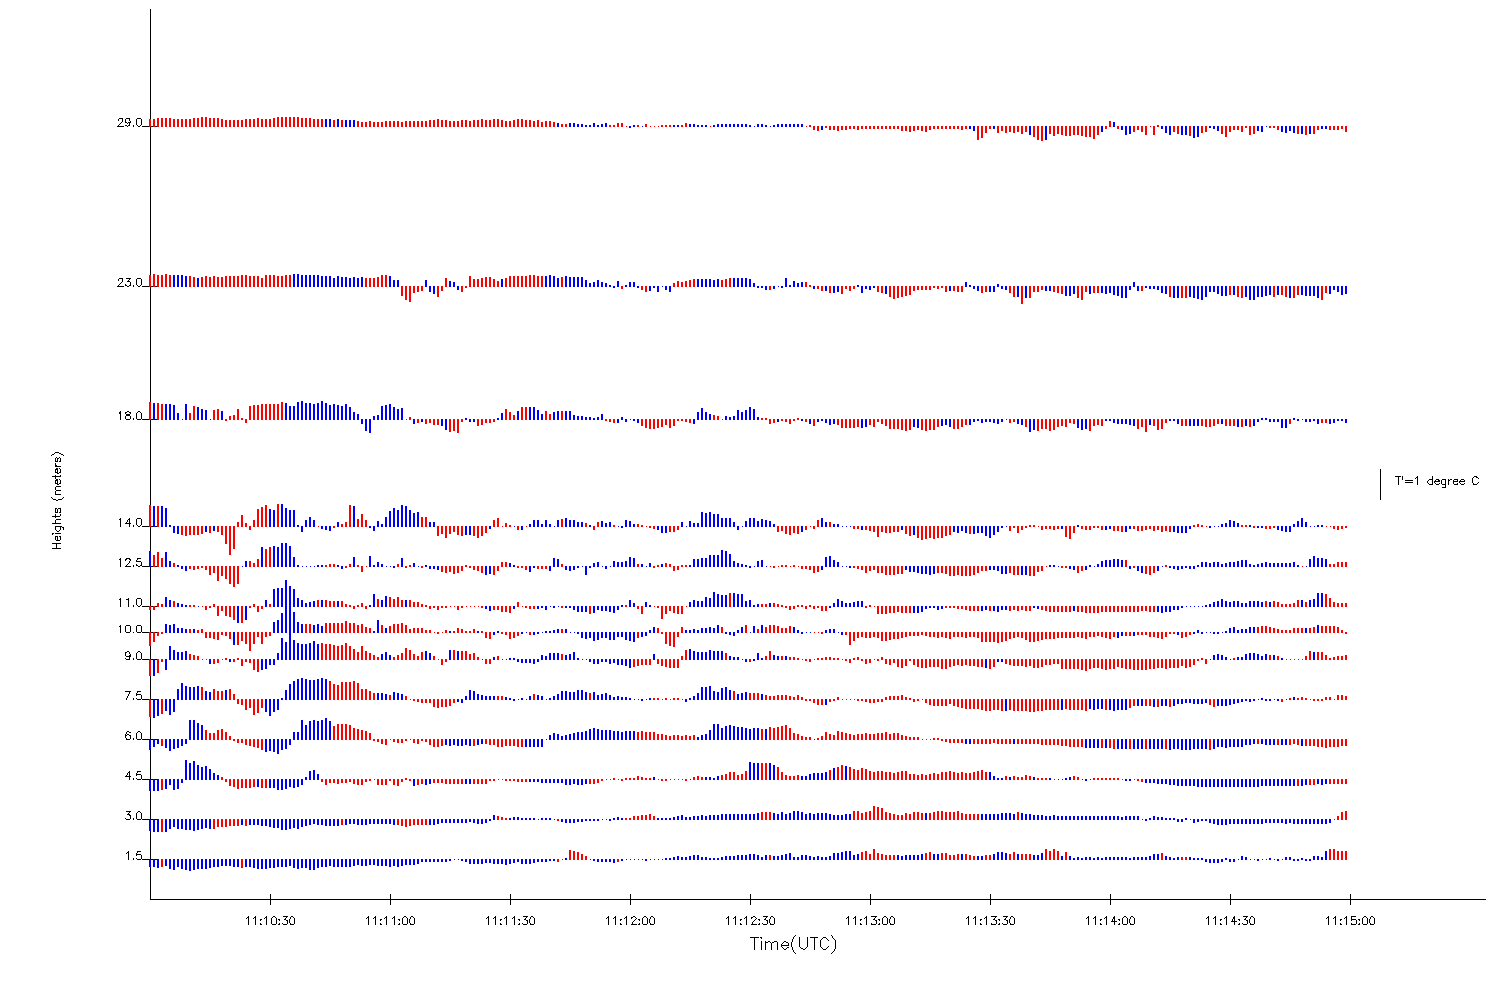
Wave Episode #29: 11 May 200711:08:49 11:13:21 UTC |
||
|---|---|---|
|
|
 |
| (5 min span) |
(5 min span) |
|
 |
|
 |
| (5 min span) |
(5 min span) |
|
 |
 |
|
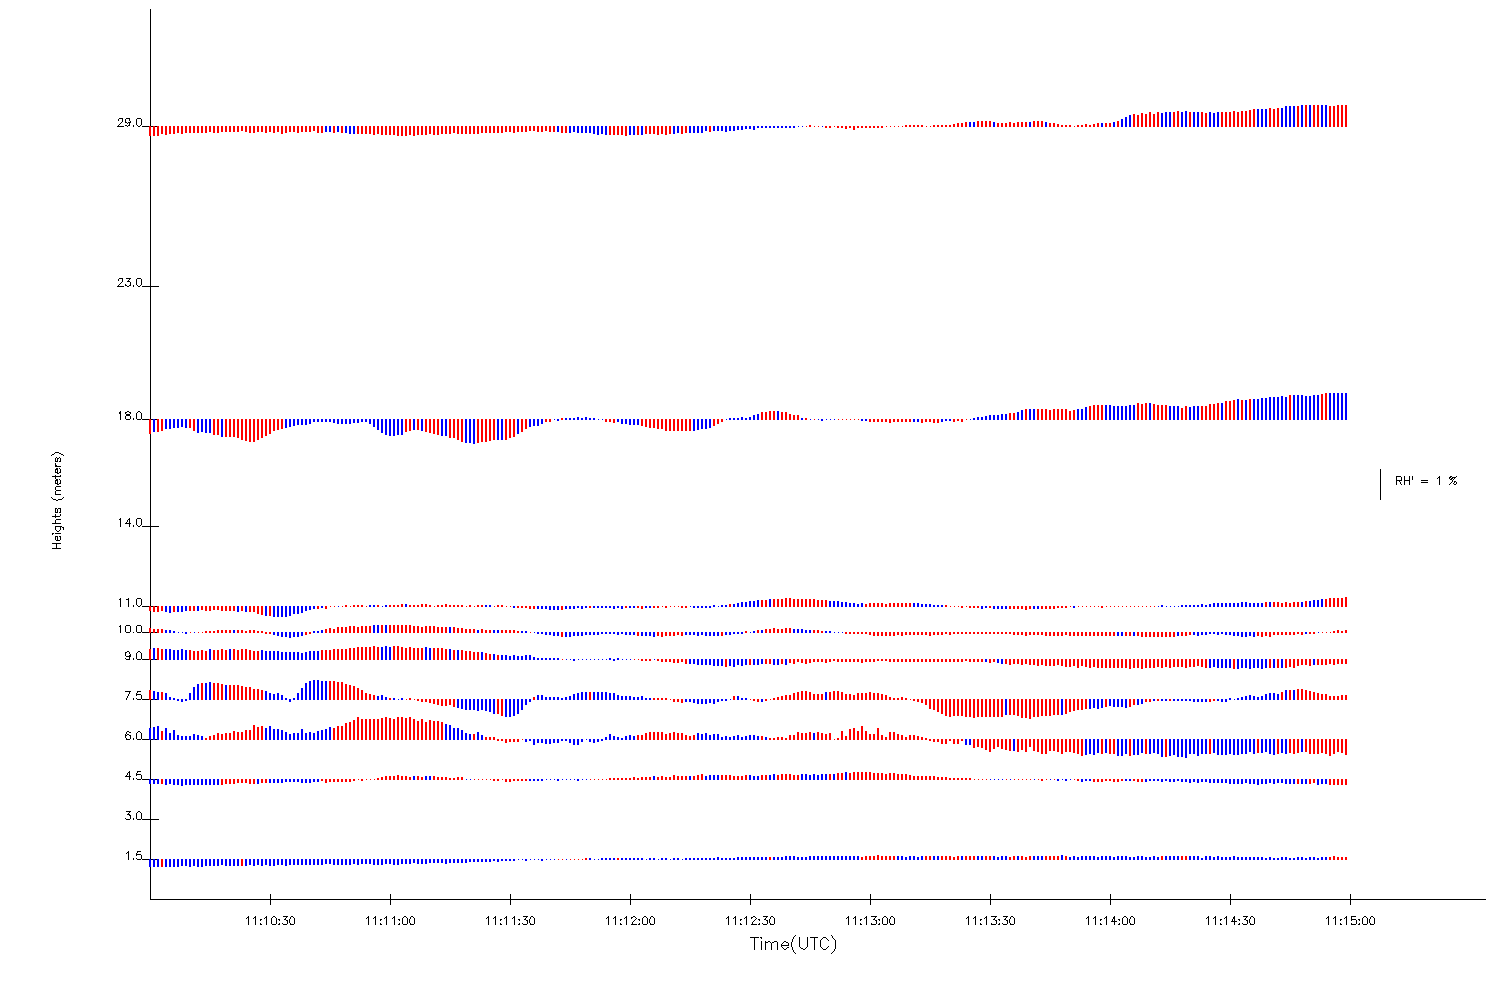
Wave Episode #29: 11 May 200711:08:49 11:13:21 UTC |
||
|---|---|---|
|
|
|
|
| (5 min span) |
(5 min span) |
|
|
|
|
| (5 min span) |
(5 min span) |
|
|
|
|