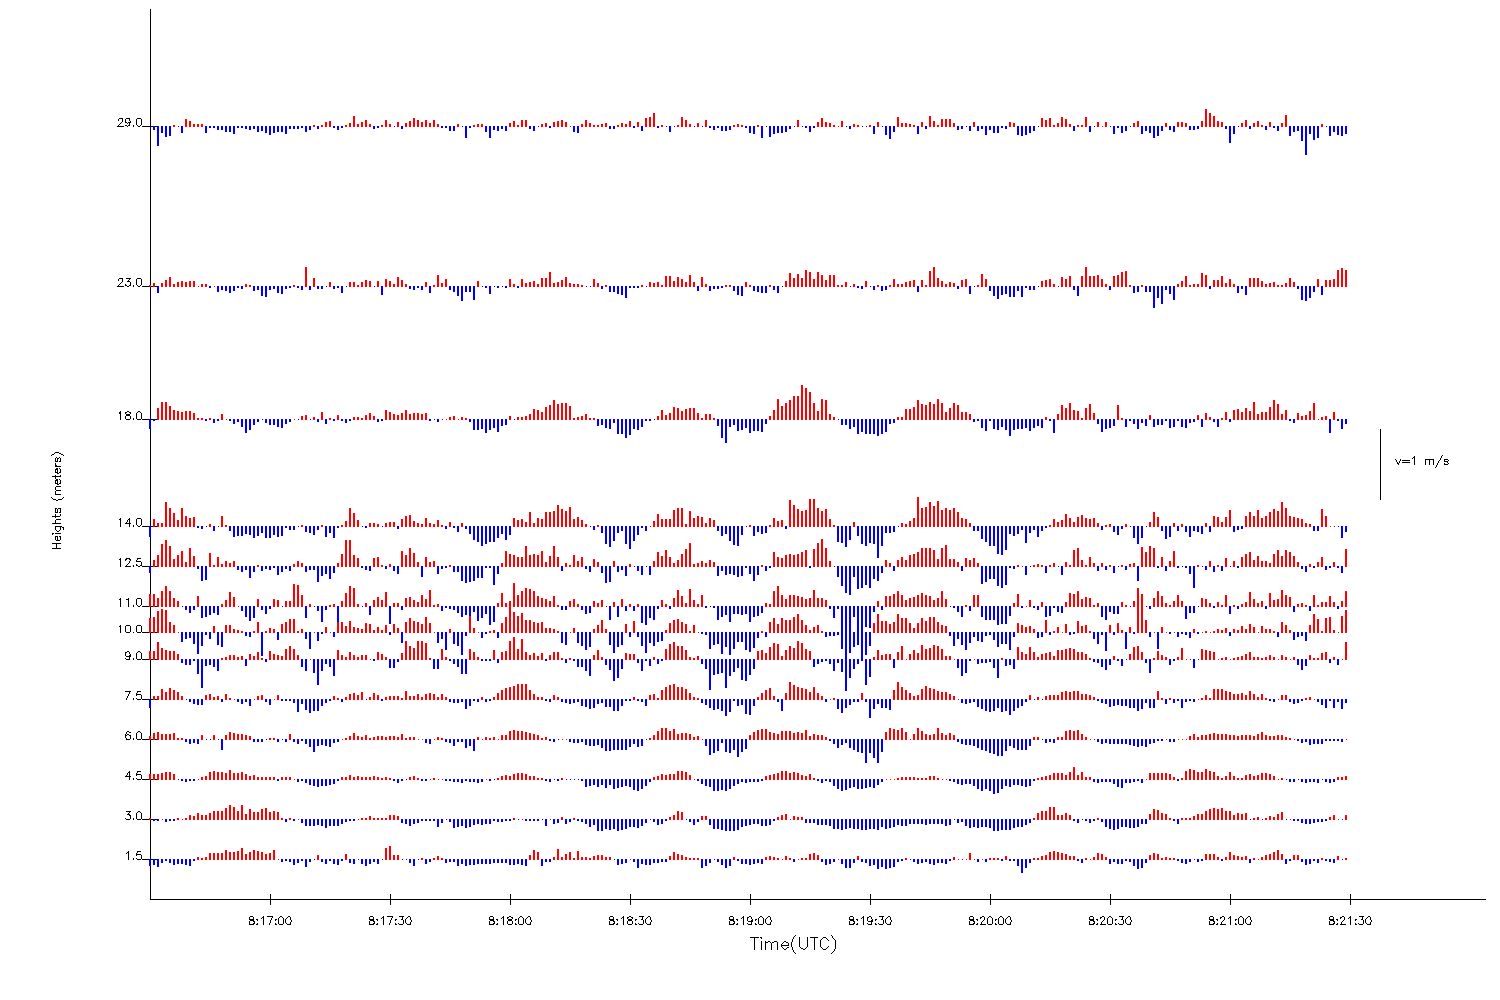
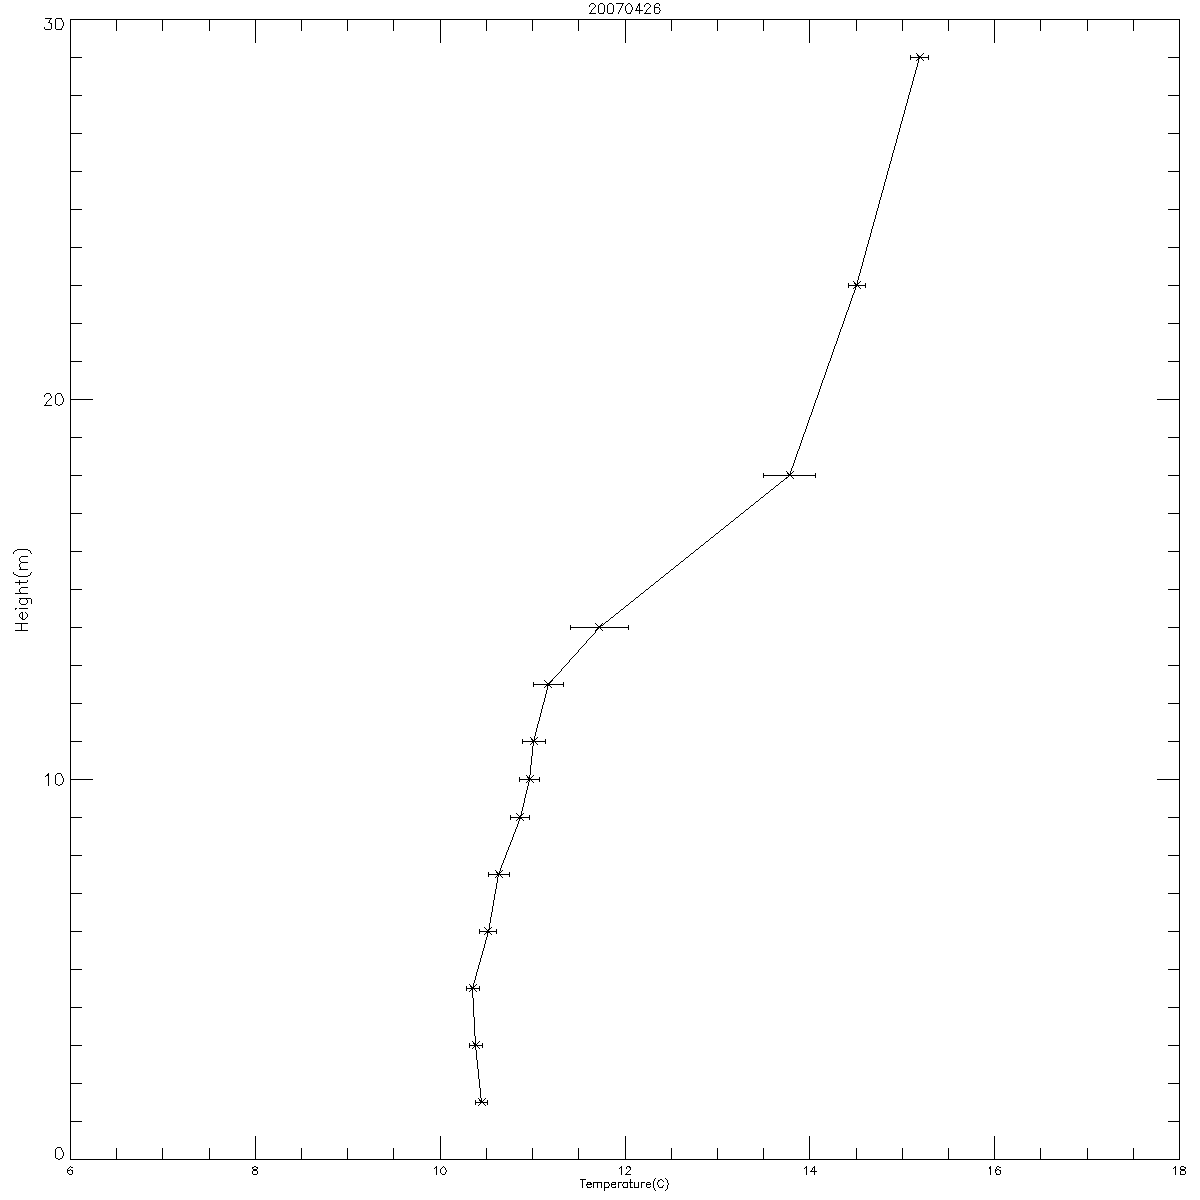
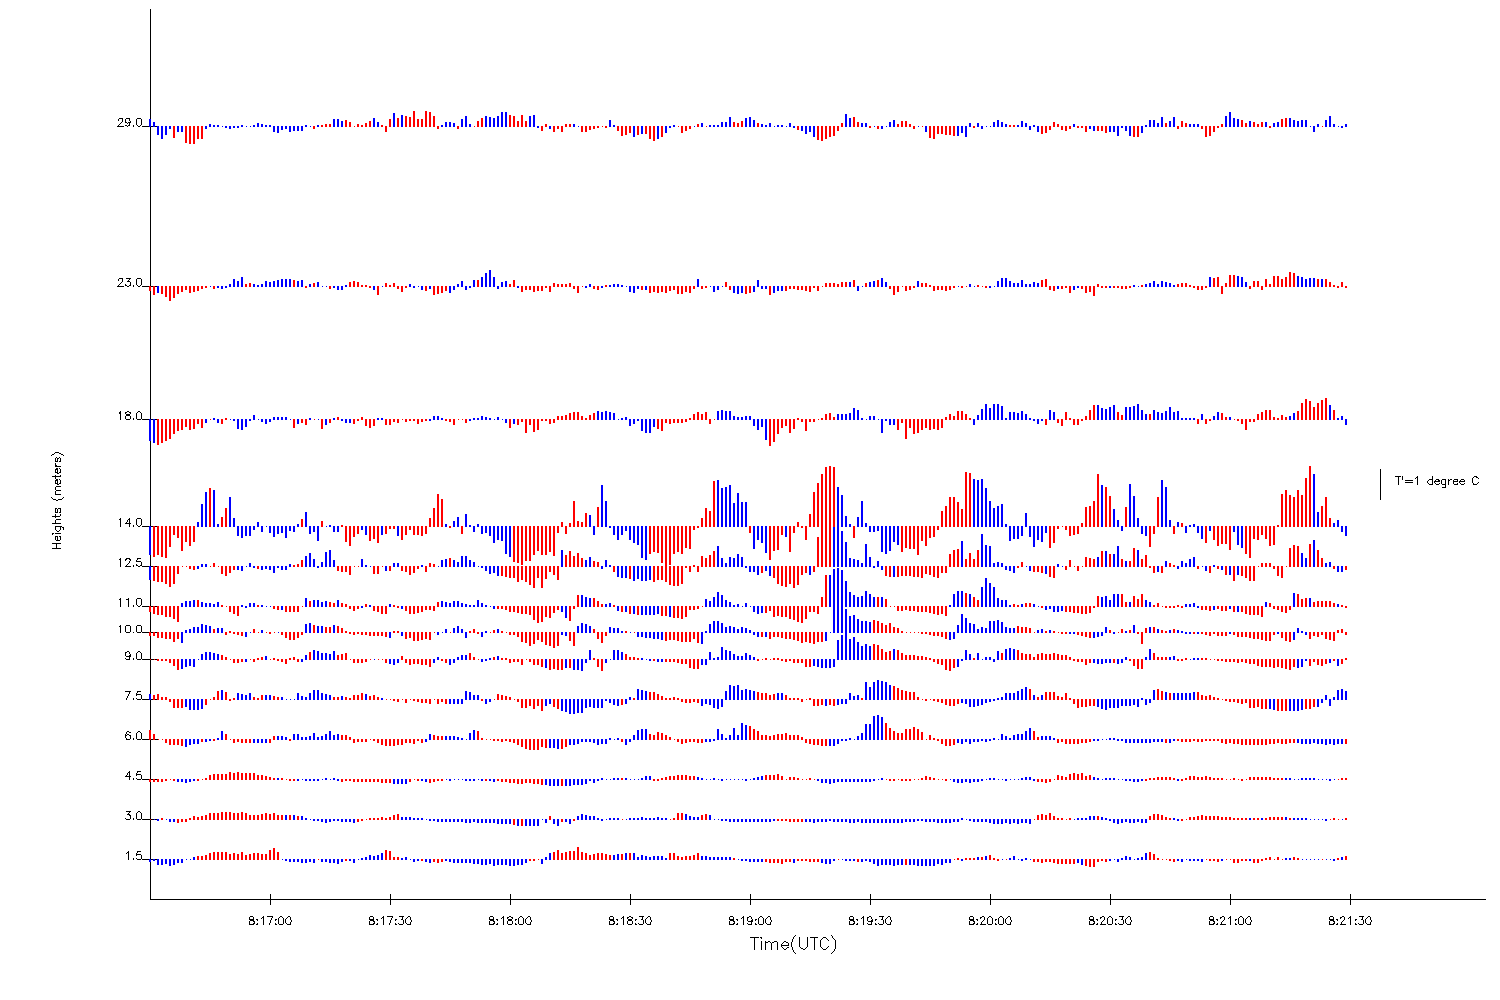
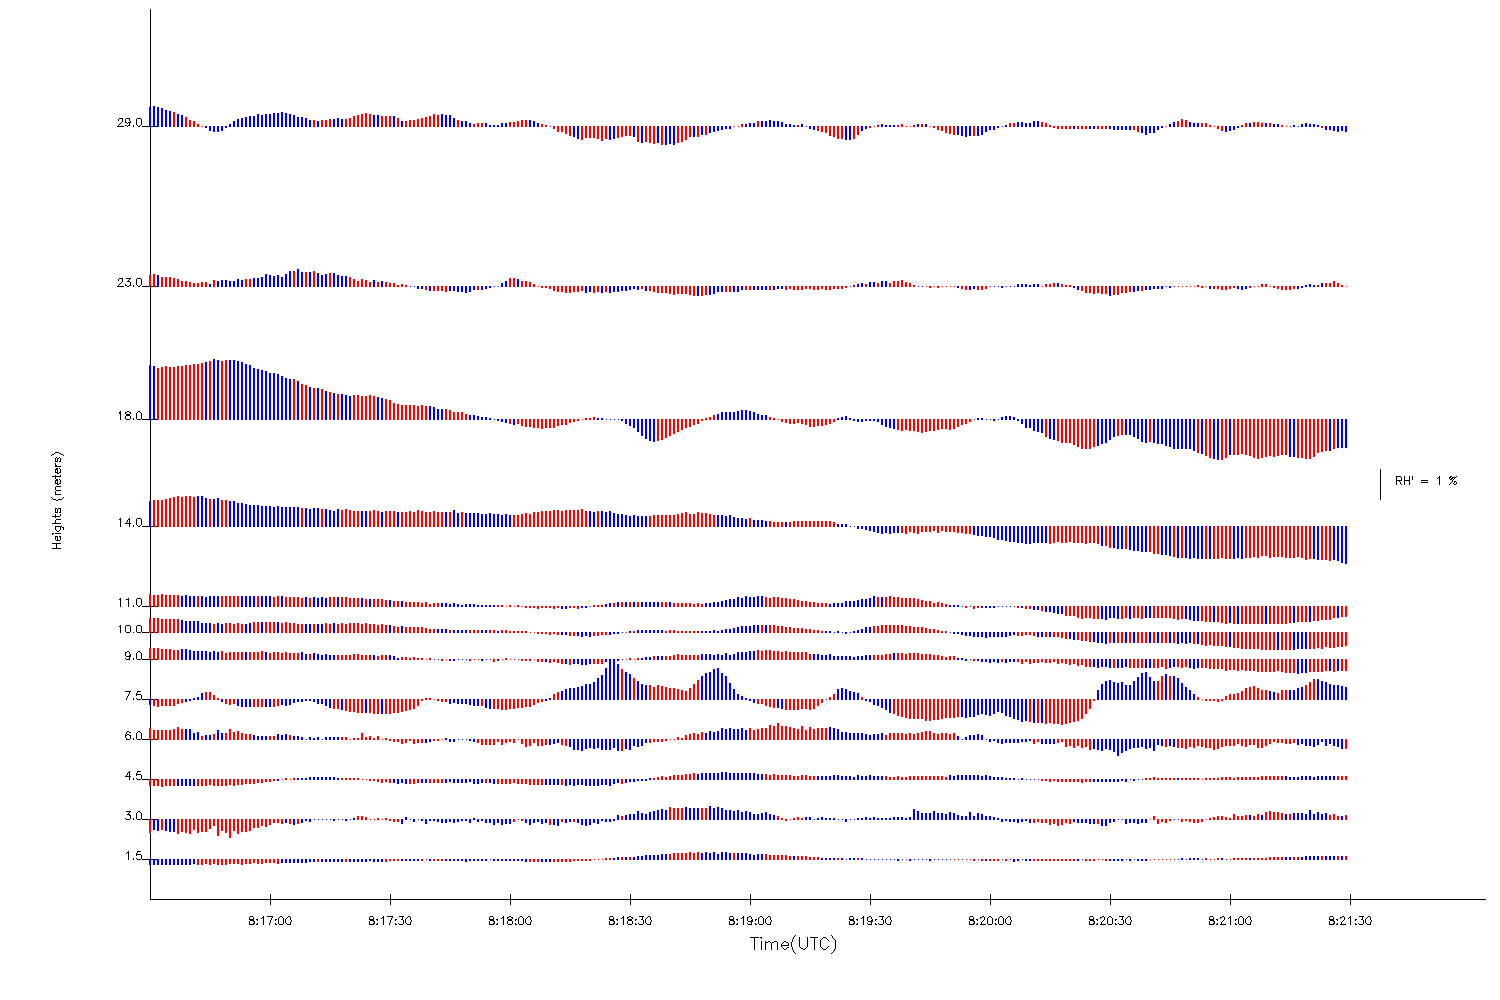
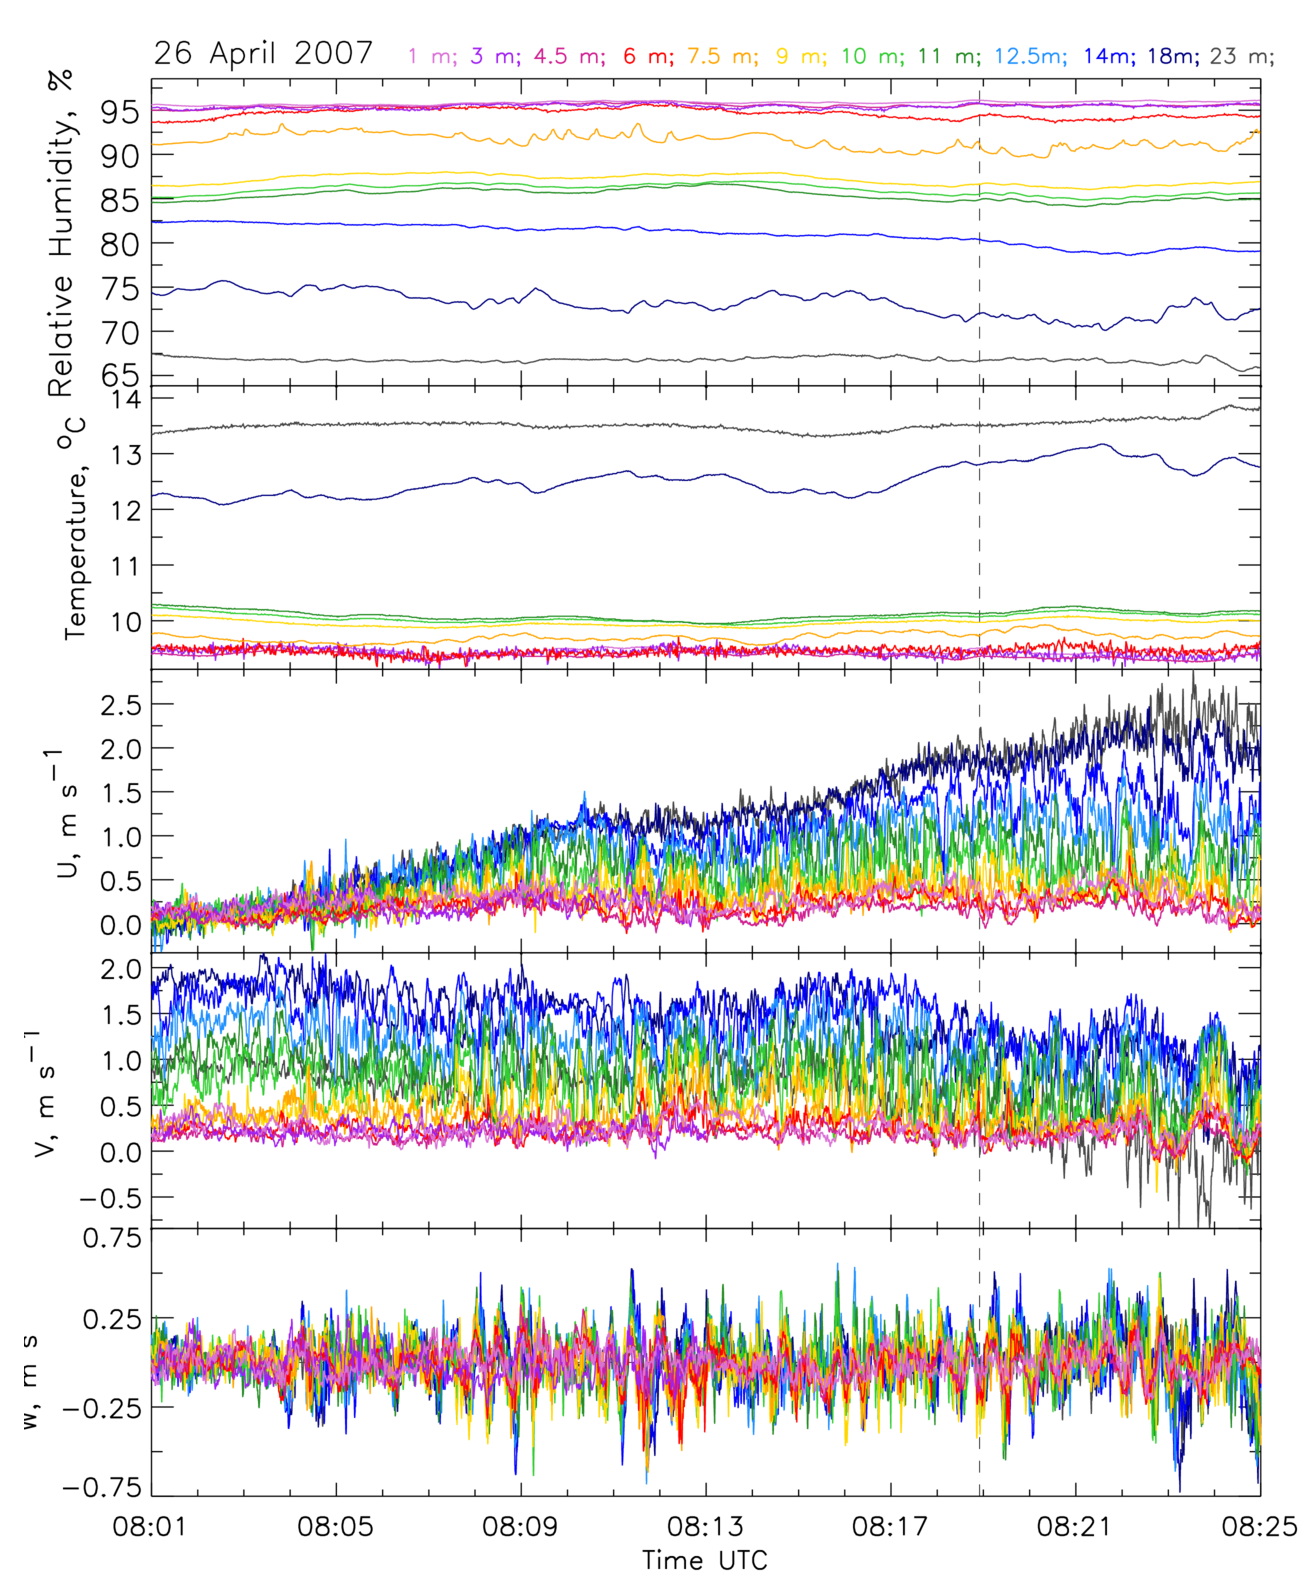
Wave Episode #16: 26 April 200708:02:47 08:22:58 UTC |
||
|---|---|---|
|
|
 |
| (5 min span) |
(5 min span) |
|
 |
 |
 |
| (5 min span) |
(5 min span) |
|
 |
 |
|
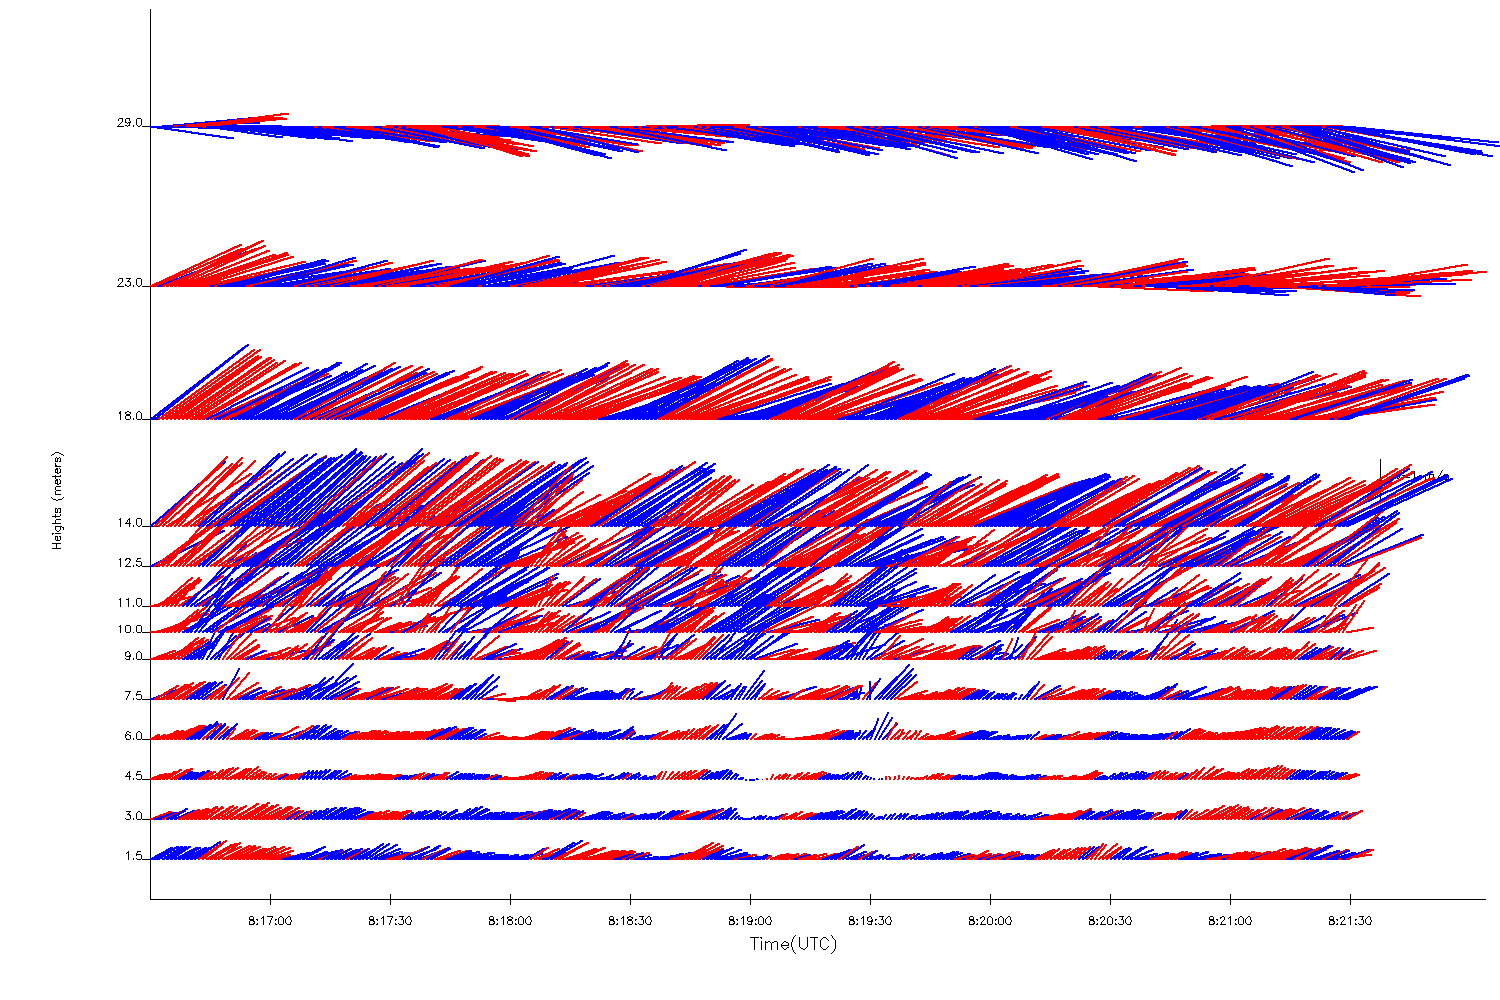
Wave Episode #16: 26 April 200708:02:47 08:22:58 UTC |
||
|---|---|---|
|
|
|
|
| (5 min span) |
(5 min span) |
|
|
|
|
| (5 min span) |
(5 min span) |
|
|
|
|