In: 11:15 am | Out: 10:15 pm
Ongoing To-do List:
• Write comparison algorithm
•
Start on advanced graphical tools
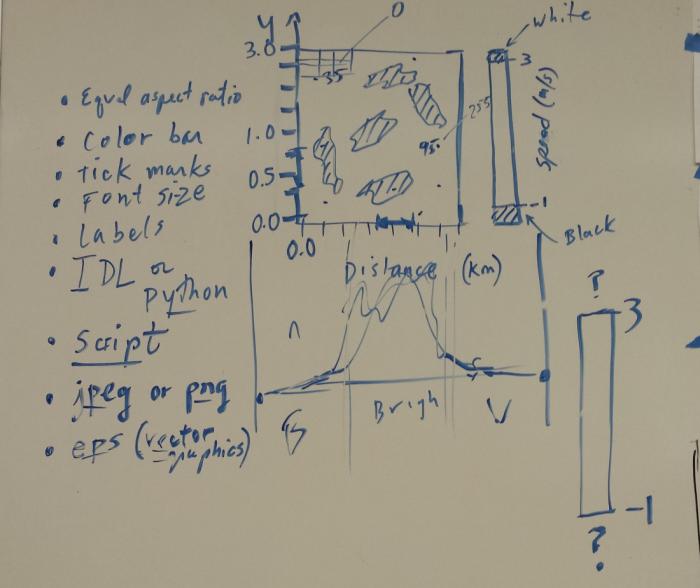
• Upload whiteboard pictures
Today I discovered the python library "mathplotlib." It's an excellent library for displaying and exporting various plots, including vector fields and color maps. It even natively supports eps exporting. I'm pretty certain it's the reason scientists seem to love python.
This library should help me meet Dr. Mayors expectations about graphical output:
So I got a few nice test programs running using matplotlib, but then I decided to take a break from programming and install 4 different monitors at my station. That has turned out to be a huge undertaking with Debian, but as of now I have 3 of them functional.