Here we applied Typhoon to the temperature field of the LES simulation below. The simulation was created by Dr. Peter Sullivan's LES and is detailed in his paper here.
Typhoon command: ./cutyphoon_server -port 60000 -nM 7 -nD 8 -nE 8 -r 1 -a 0.01


The above video shows the movement of the temperature field in the simulation. The two images shown reflect the data passed to Typhoon; they are 15 seconds apart to match the time interval of the REAL hardware.

Horizontal wind speed averaged from seventeen LES frames between those passed to Typhoon.

Horizontal wind speed inferred by cutyphoon_server from the passive tracer data corresponding to the same frames.

Differences between speeds in above images.

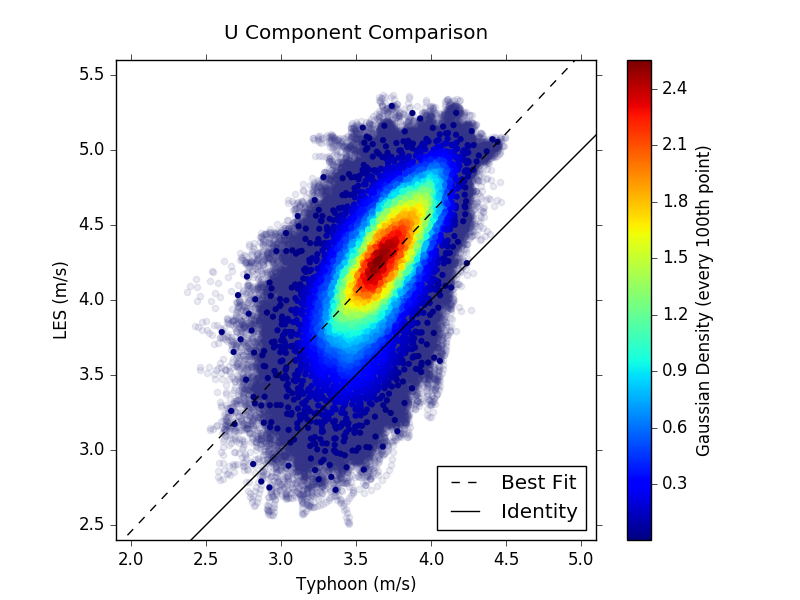
Wind u component averaged from seventeen LES frames between those passed to Typhoon.

U components inferred by cutyphoon_server from the passive tracer data corresponding to the same frames.

Differences between u components in above images.

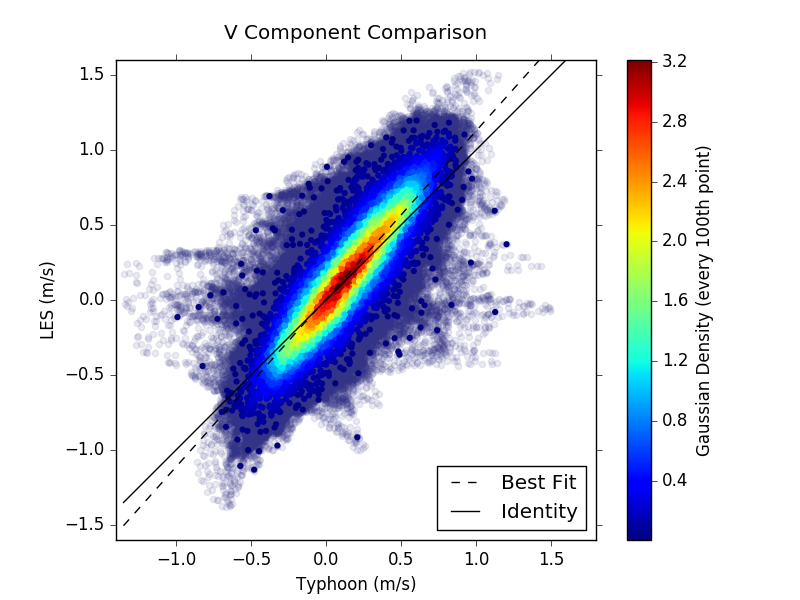
Wind v component averaged from seventeen LES frames between those passed to Typhoon.

V components inferred by cutyphoon_server from the passive tracer data corresponding to the same frames.

Differences between v components in above images.


