For our first experiment we applied Typhoon to some LES temperature fields (fields detailed below). For this simple initial test, we used the only basic Typhoon interface "cutyphoon" and specified no numeric parameters. See later experiments for more interesting results.
Typhoon command: ./cutyphoon -disp true -i0 /home/kbrownell/Images/Img001.tif -i1 /home/kbrownell/Images/Img002.tif


This is a large eddy simulation (LES) using the NCAR-LES code on a domain of size \((Lx,Ly,Lz) = (5120,5120,2048)m\). The domain is periodic in the x and y directions and the boundary layer is initialized with a capping inversion at \(z = 1000m\). The flow is forced with a geostrophic wind of \(10 m/s\) and a surface heat flux of \(0.5 W/m^2\). The grid size for the computations is \(256\times 256\times 256\). The horizontal slice shown in the image is taken at a height of \(z = 200m\).

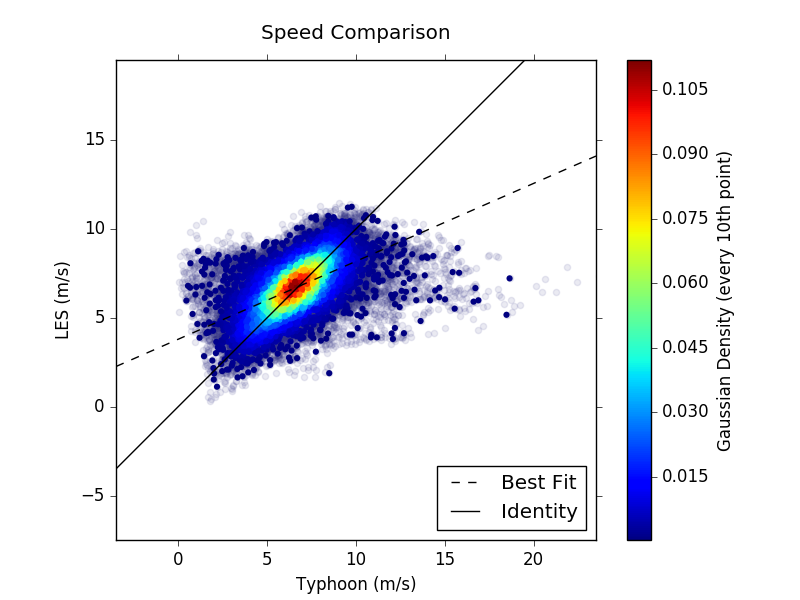
Horizontal wind speed averaged from the two consecutive LES frames.

Horizontal wind speed inferred by cutyphoon for data corresponding to the same frames. For now the input frames were forced into an integer .tif image for simple use of Typhoon.

Differences between speeds in above images. Note the significant errors, which can likely be reduced by adjusting some advanced parameters in Typhoon.

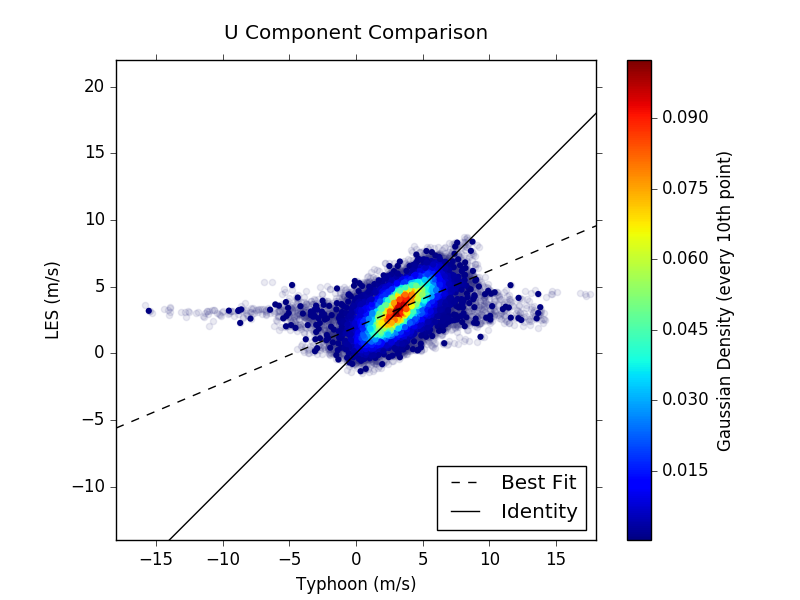
Wind u component averaged from the two consecutive LES frames.

U components inferred by cutyphoon for data corresponding to the same frames. For now the input frames were forced into an integer .tif image for simple use of Typhoon.

Differences between u components in above images. Note the significant errors, which can likely be reduced by adjusting some advanced parameters in Typhoon.

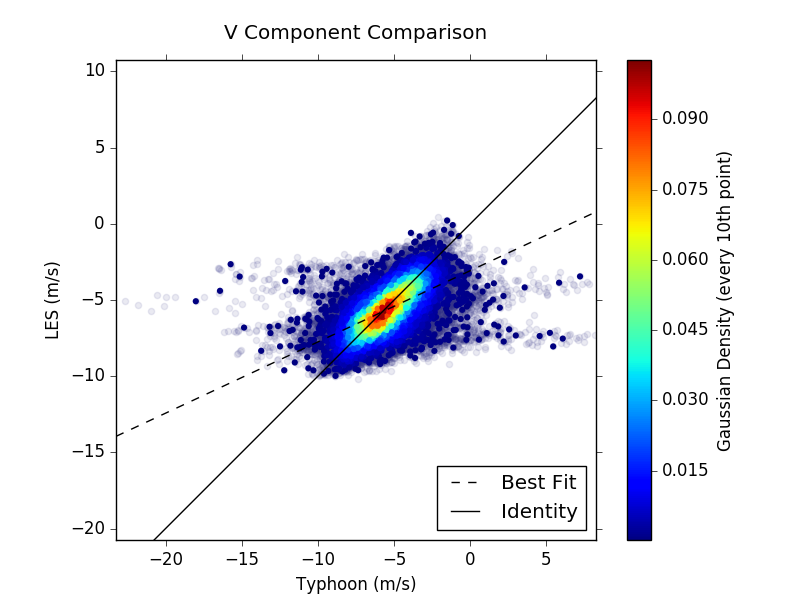
Wind v component averaged from the two consecutive LES frames.

V components inferred by cutyphoon for data corresponding to the same frames. For now the input frames were forced into an integer .tif image for simple use of Typhoon.

Differences between v components in above images. Note the significant errors, which can likely be reduced by adjusting some advanced parameters in Typhoon.
