Here we applied Typhoon to the same LES temperature fields from Experiment 1 (again detailed below). This time we used to more advanced Typhoon interface "cutyphoon_server" and specified some parameters recommended by its creator, Dr. Pierre Derian. Because of the improved interface, we were able to input the LES data in full resolution.
Typhoon command: ./cutyphoon_server -port 60000 -nM 7 -nD 8 -nE 8 -r 1 -a 0.01


This is a large eddy simulation (LES) using the NCAR-LES code on a domain of size \((Lx,Ly,Lz) = (5120,5120,2048)m\). The domain is periodic in the x and y directions and the boundary layer is initialized with a capping inversion at \(z = 1000m\). The flow is forced with a geostrophic wind of \(10 m/s\) and a surface heat flux of \(0.5 W/m^2\). The grid size for the computations is \(256\times 256\times 256\). The horizontal slice shown in the image is taken at a height of \(z = 200m\).

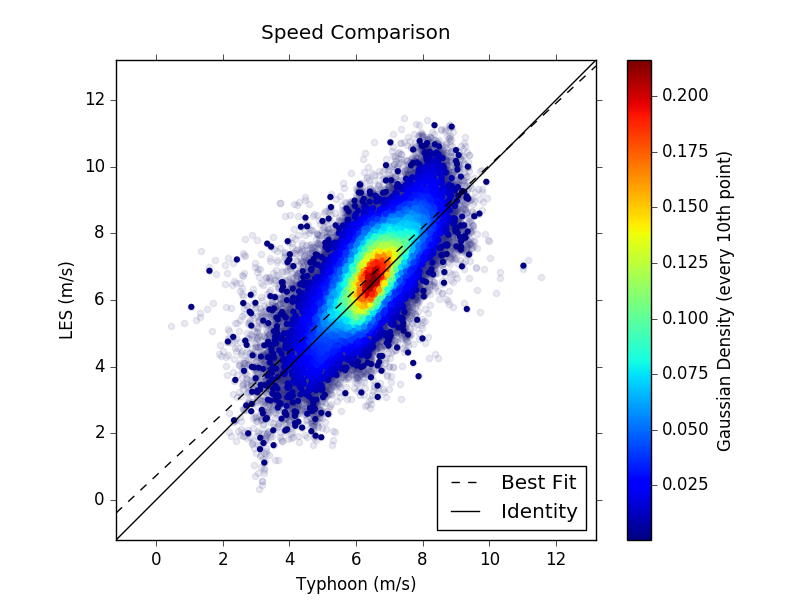
Horizontal wind speed averaged from the two consecutive LES frames.

Horizontal wind speed inferred by cutyphoon_server for data corresponding to the same frames.

Differences between speeds in above images. Note the significantly reduced errors compared to Experiment 1.

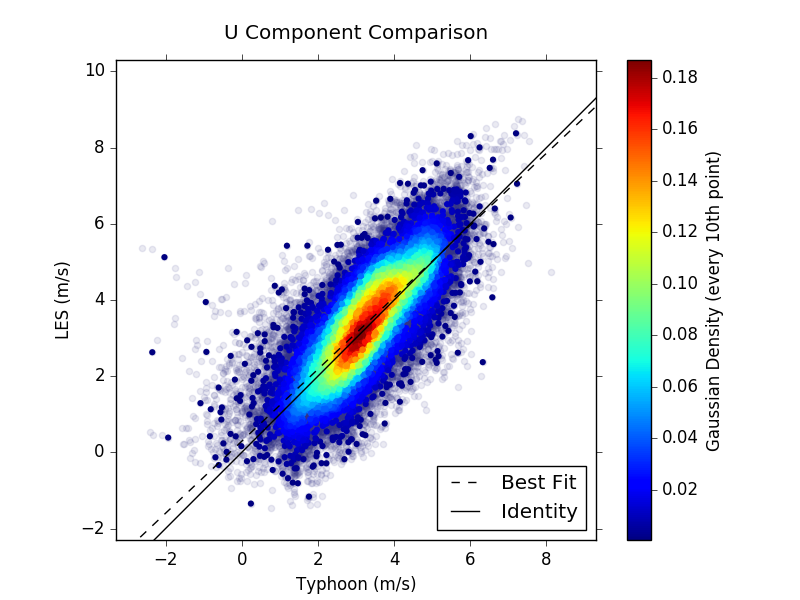
Wind u component averaged from the two consecutive LES frames.

U components inferred by cutyphoon_server for data corresponding to the same frames.

Differences between u components in above images. Note the significantly reduced errors compared to Experiment 1.

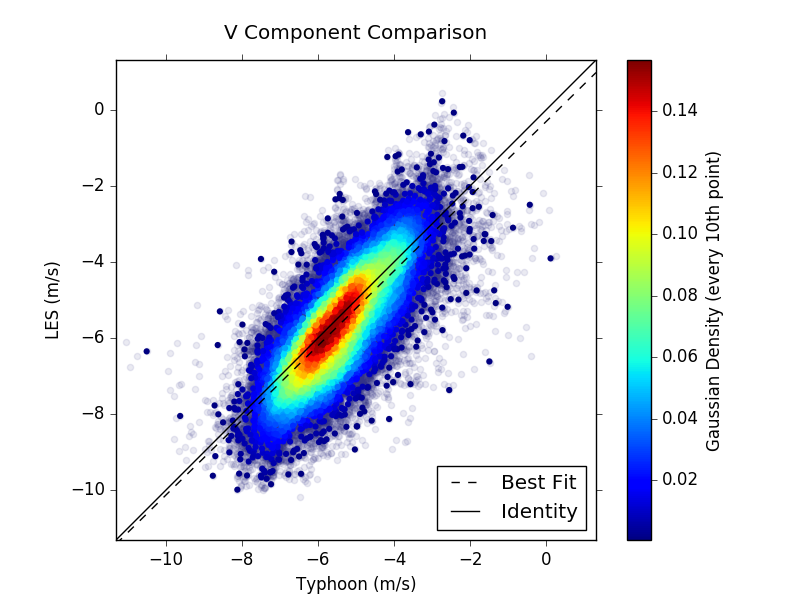
Wind v component averaged from the two consecutive LES frames.

V components inferred by cutyphoon_server for data corresponding to the same frames.

Differences between v components in above images. Note the significantly reduced errors compared to Experiment 1.

