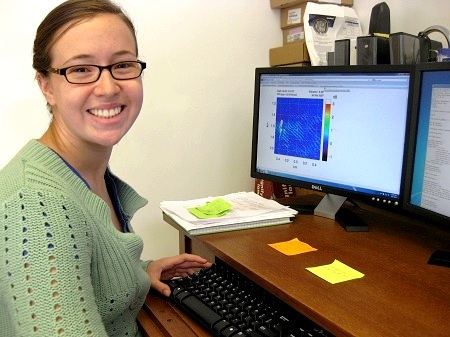
Liz Jachens
Project Description
I created a webpage where all 52 canopy wave episodes will be available for viewing, including images, animations, wavelength, phase speed and propagation direction*, timeseries data, temperature profiles, and wind plots.
The link is available under the examples tab in the menu bar or by clicking
here.
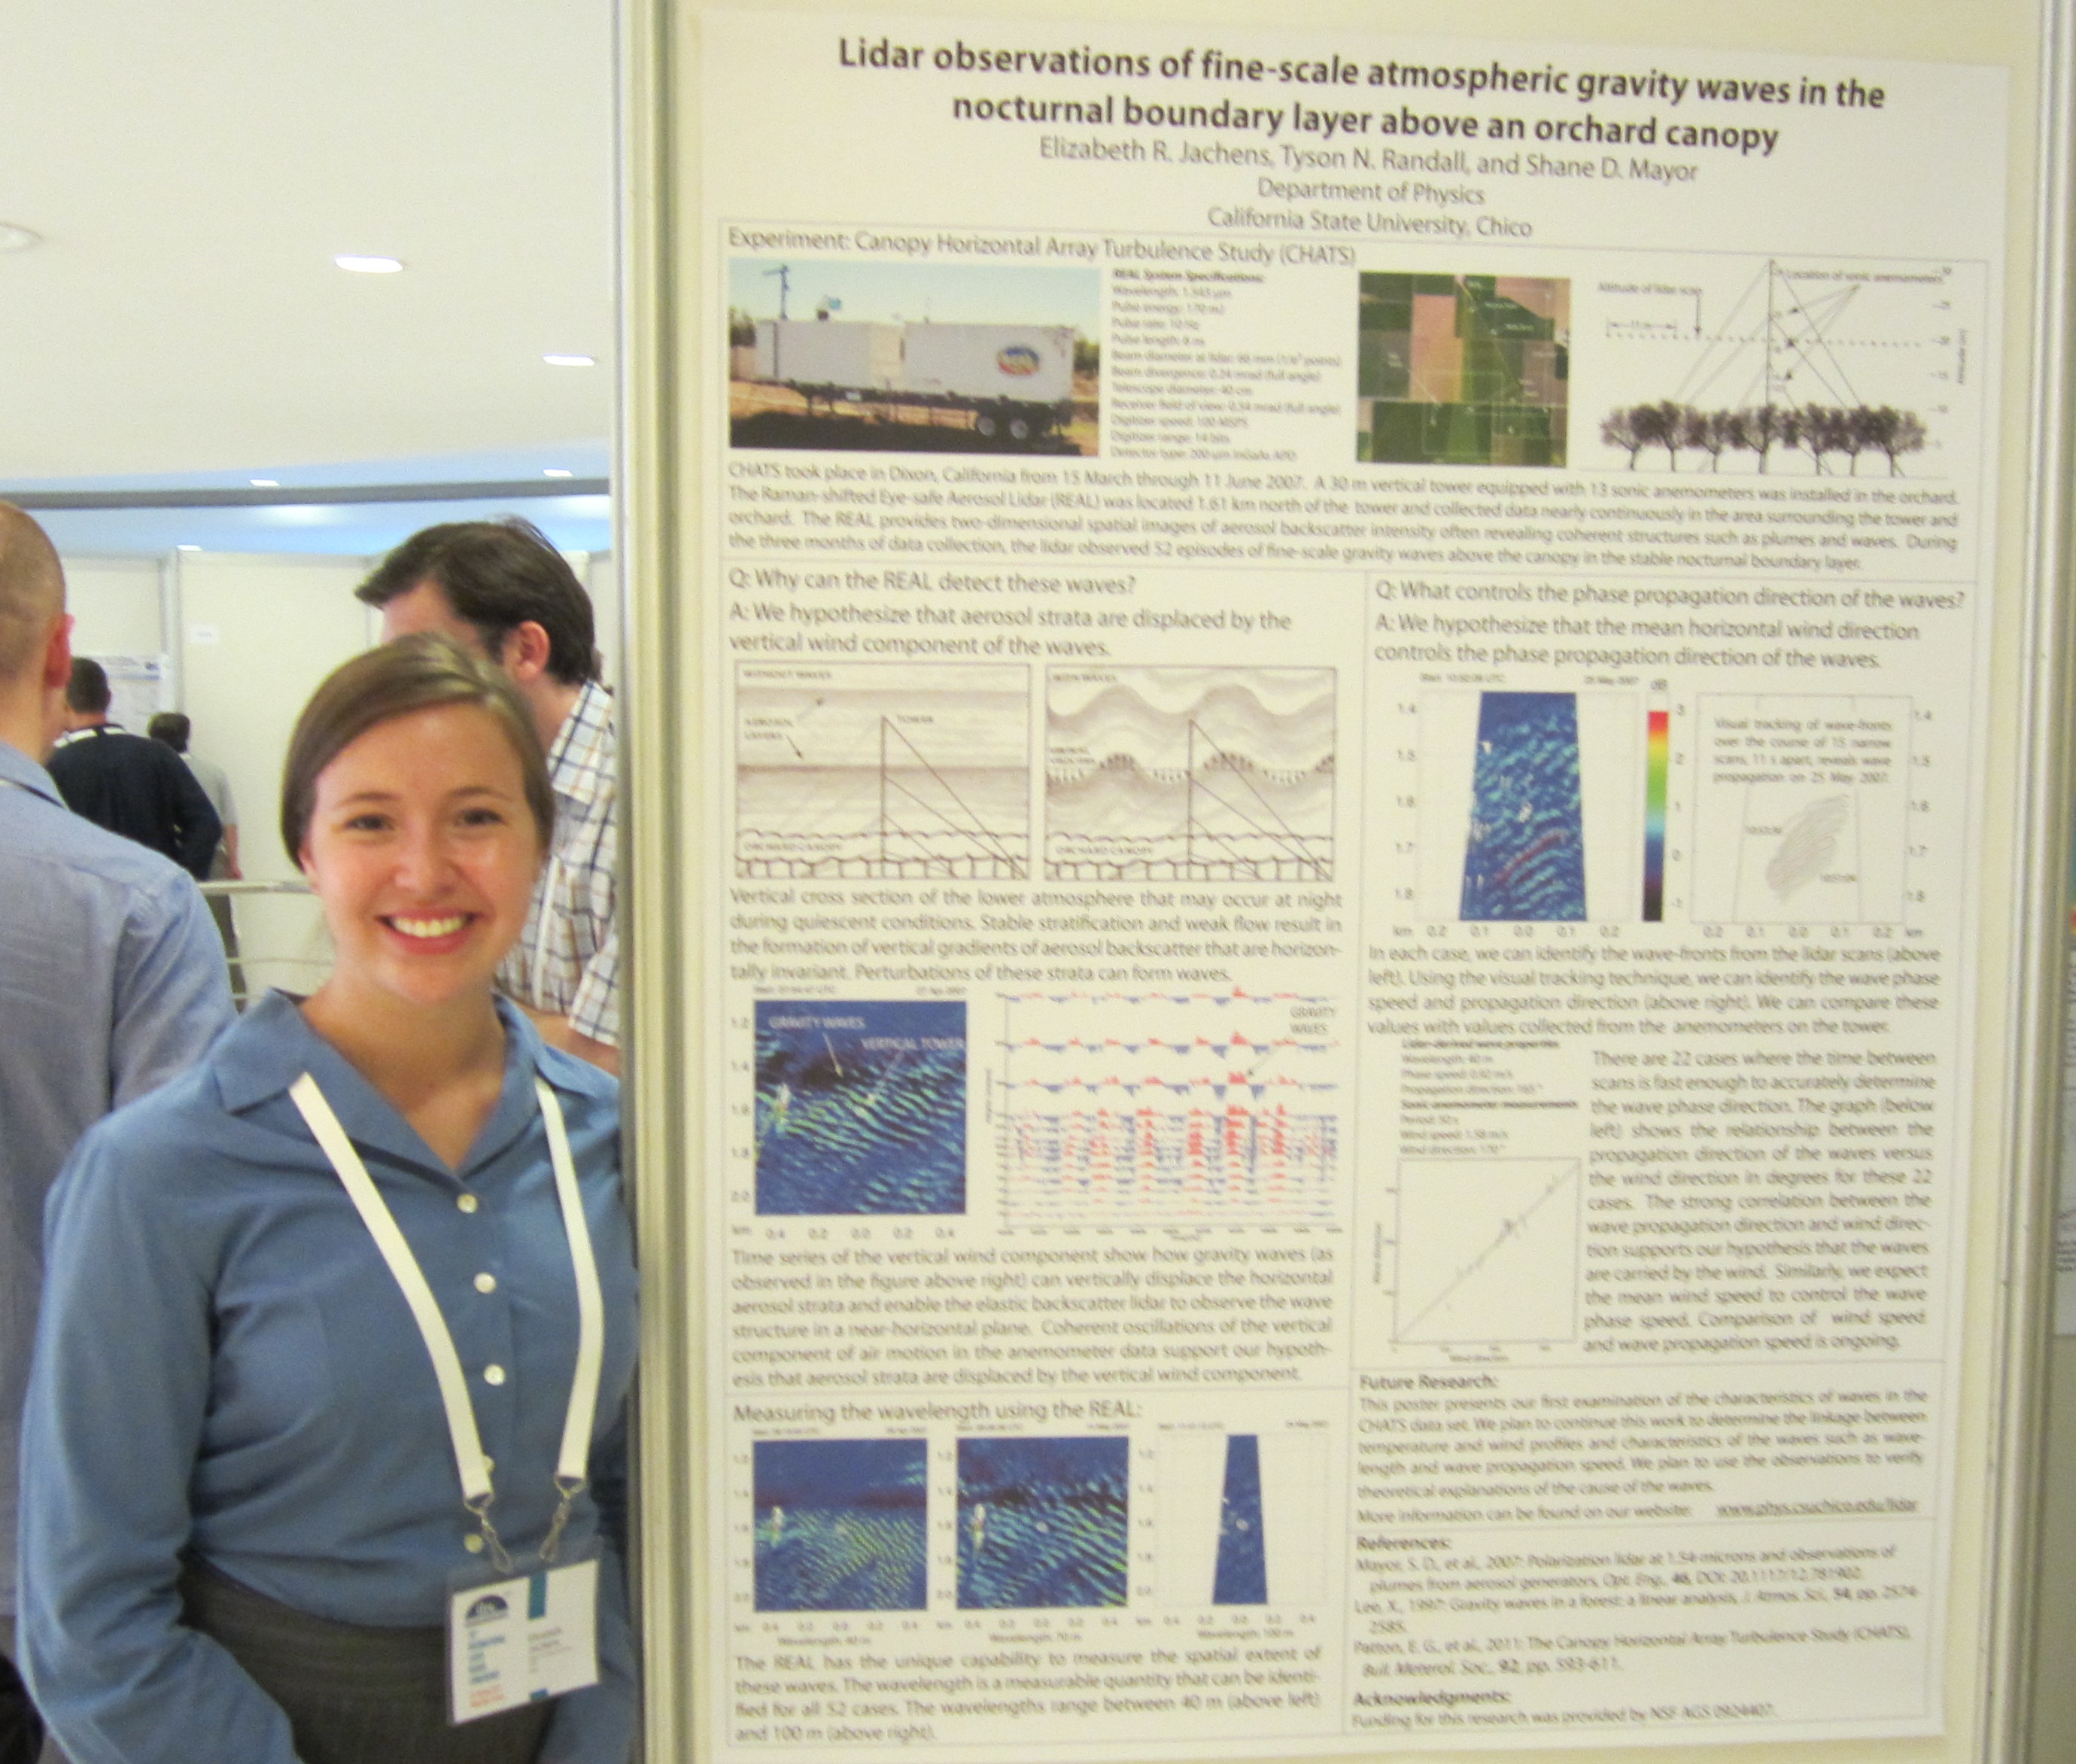
I coauthored a conference paper with Tyson Randall and Dr. Shane Mayor for the 26th International Laser Radar Conference in Porto Heli, Greece in spring 2012. My paper was accepted and I presented my poster during the poster presentation session at the conference 25-29 June 2012. To view the paper click here or to view the poster click here. The picture to the right is me during my poster session on Tuesday night at ILRC.
At the end of July I attended a two day workshop of Wave-Turbulance Interactions in Stable Atmospheric Boundary Layers held by the National Center for Atmoshperic Research in Boulder, Colorado.
I started working for the Lidar group in summer of 2011. I identified all episodes of fine-scale waves that occur in the REAL data from CHATS and are located within a 1-square km area near the ISFF vertical tower (VT). I found 52 cases. For each case, I made zoomed-in images, time-lapse animations, and estimated the wavelength. I made plots of them time series data from the ISFF VT. Also using the time series data, I calculated Richardson number from the tower data. The summer goal was to gather and organize all material necessary for a comprehensive analysis of the waves. In the fall I continued to investigate small scale waves. I worked on a comparison between the physical structure of the waves and the fluctuations in the in-situ data using relative humidity and the temperature gradient.
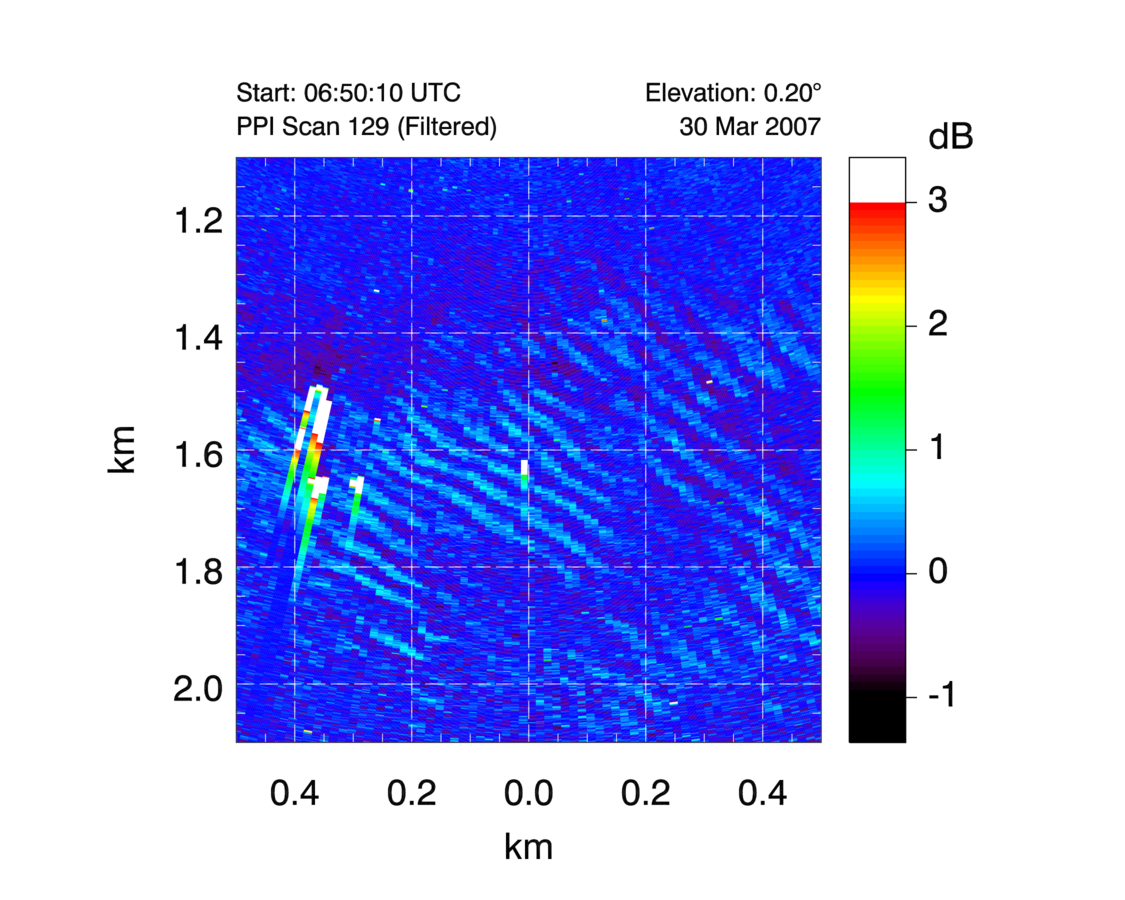
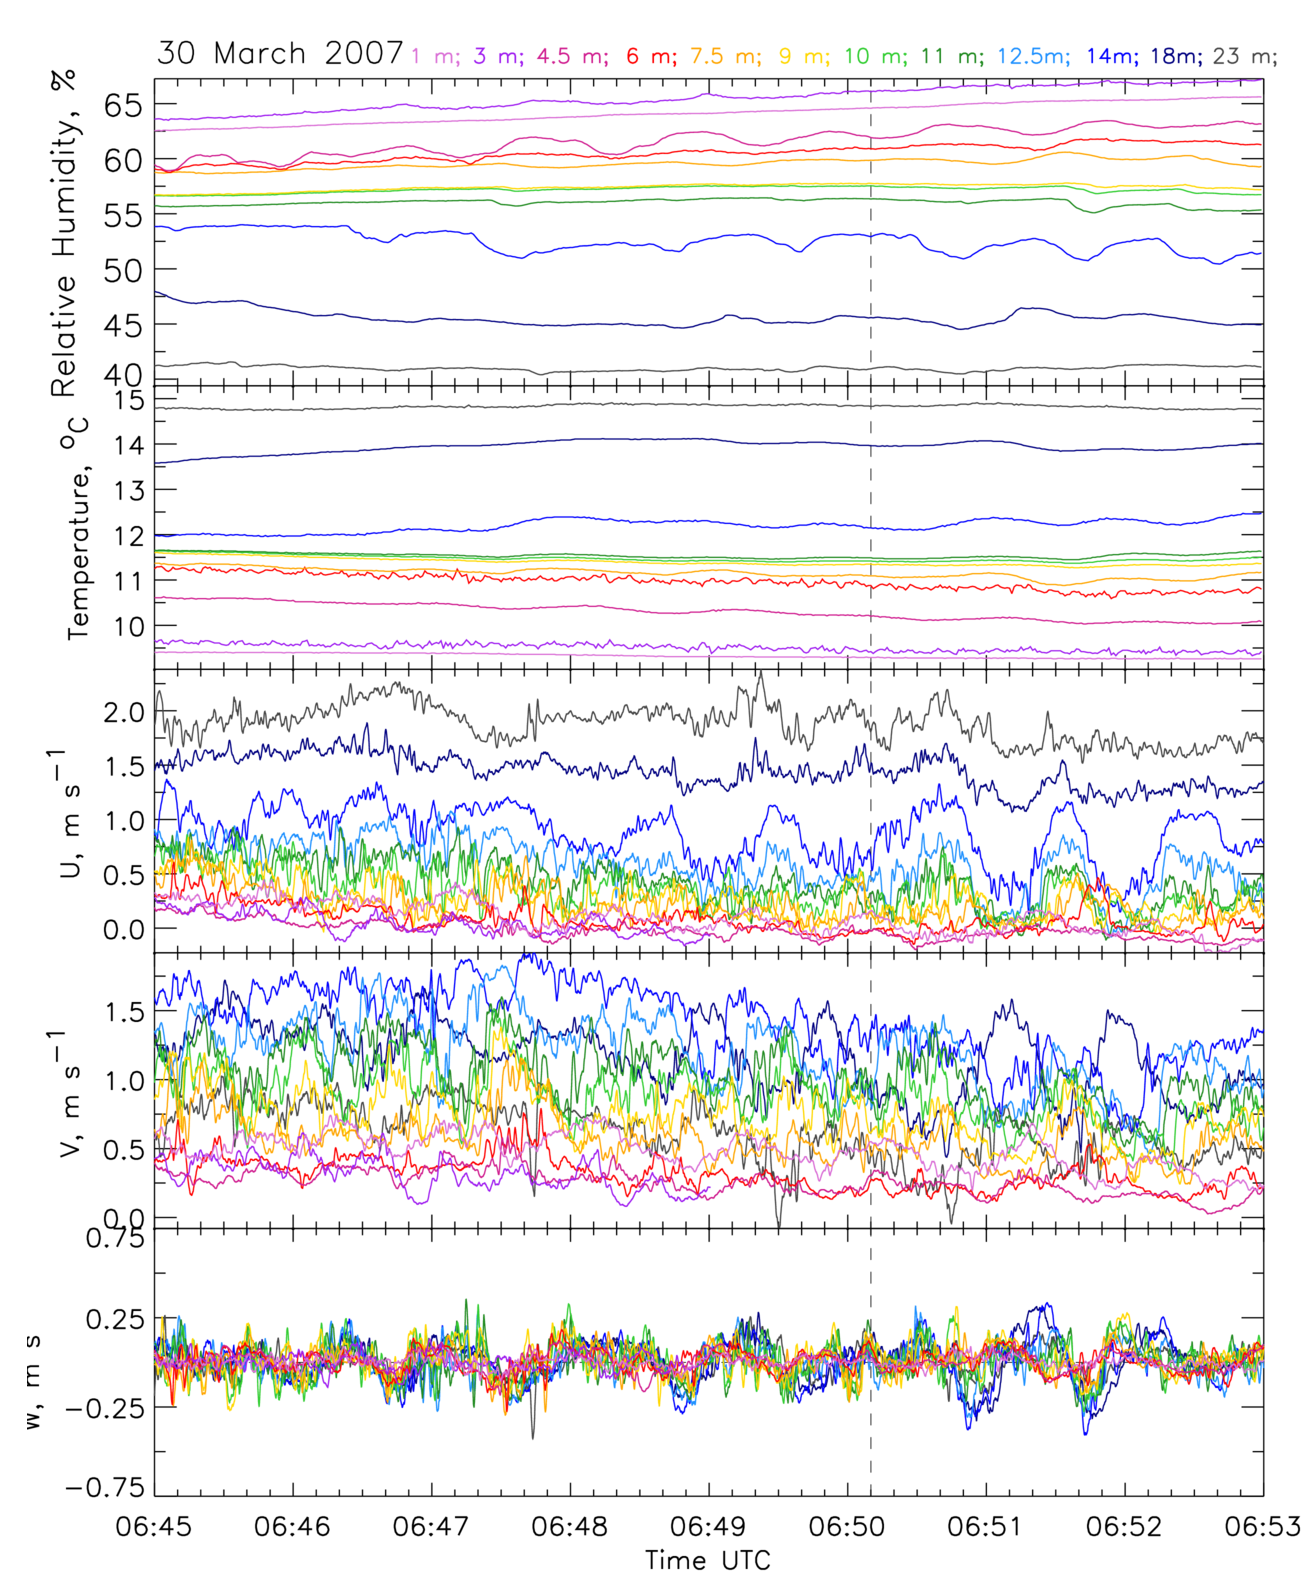
Wave Episode Example: 30 March 2007
In this wave case, the wavelength is approximately 50 meters. This is one of the smaller wavelenths, ranging between 40 and 110 meteres. The duration of the episode is 7 minutes 19 seconds. In the episode, there are a total of 25 frames and the time between the frames is 17 seconds.
- Watch zoomed-in animation (mpeg)
- Watch zoomed-in animation (wmv)
- Watch zoomed-in animation (gif): to replay animation refresh the browser page
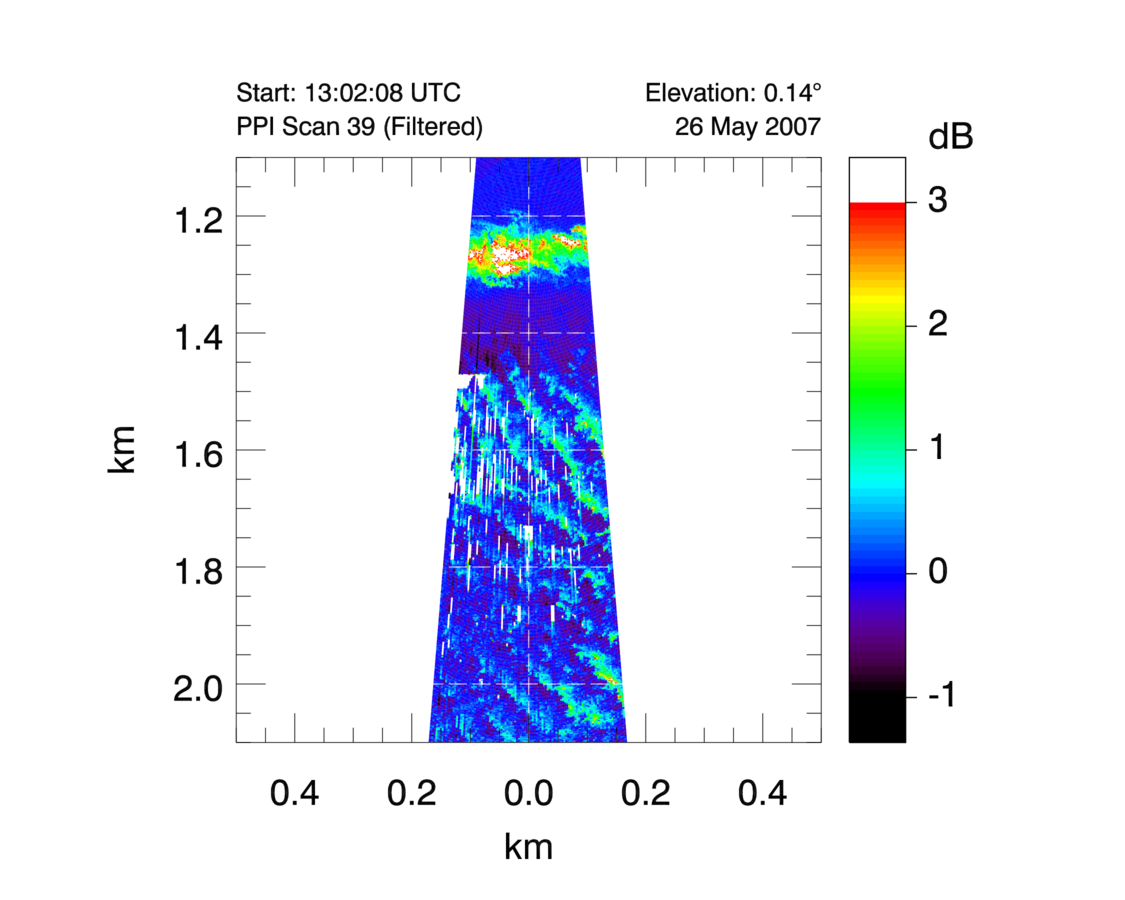
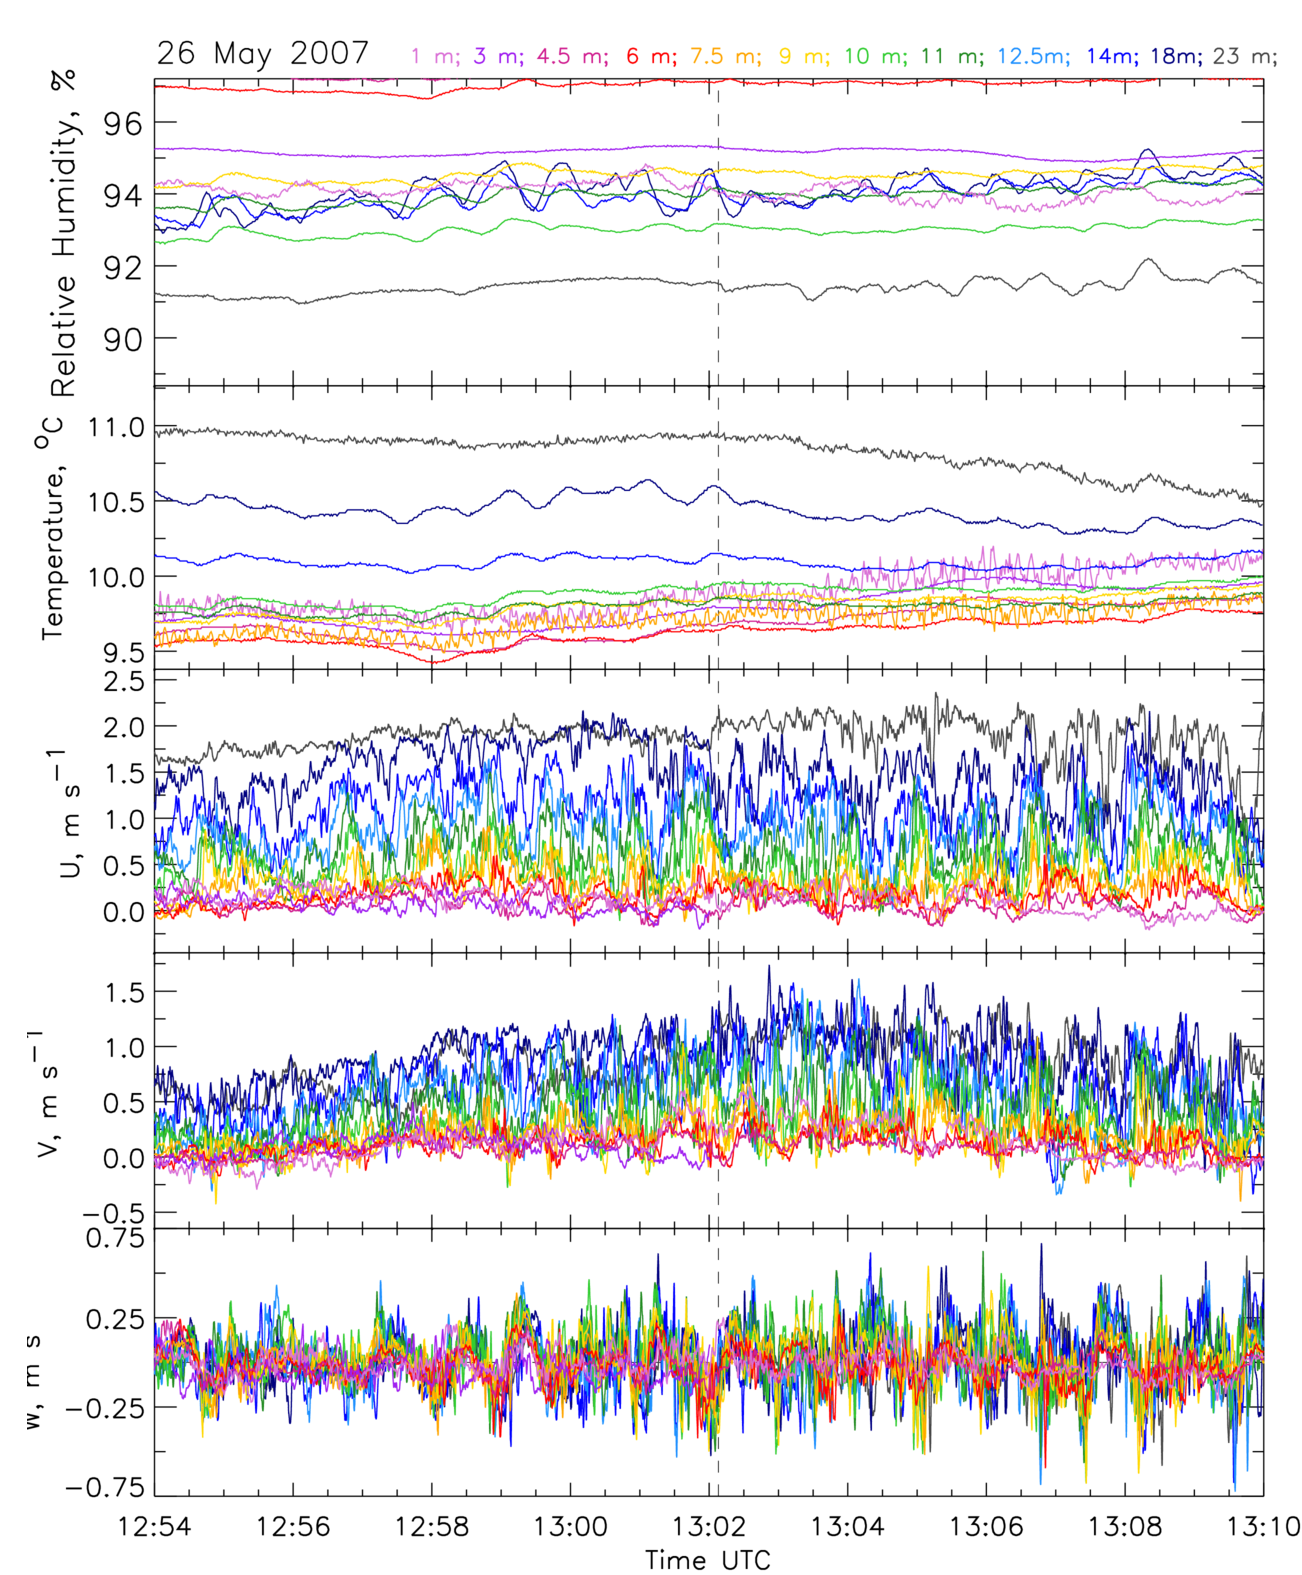
Wave Episode Example: 26 May 2007
In this wave case, the wavelength is approximately 70 meters. The duration of the episode is 14 minutes 9 seconds. In the episode, there are a total of 79 frames and the time between the frames is 11 seconds.
- Watch zoomed-in animation (mpeg)
- Watch zoomed-in animation (wmv)
- Watch zoomed-in animation (gif): to replay animation refresh the browser page
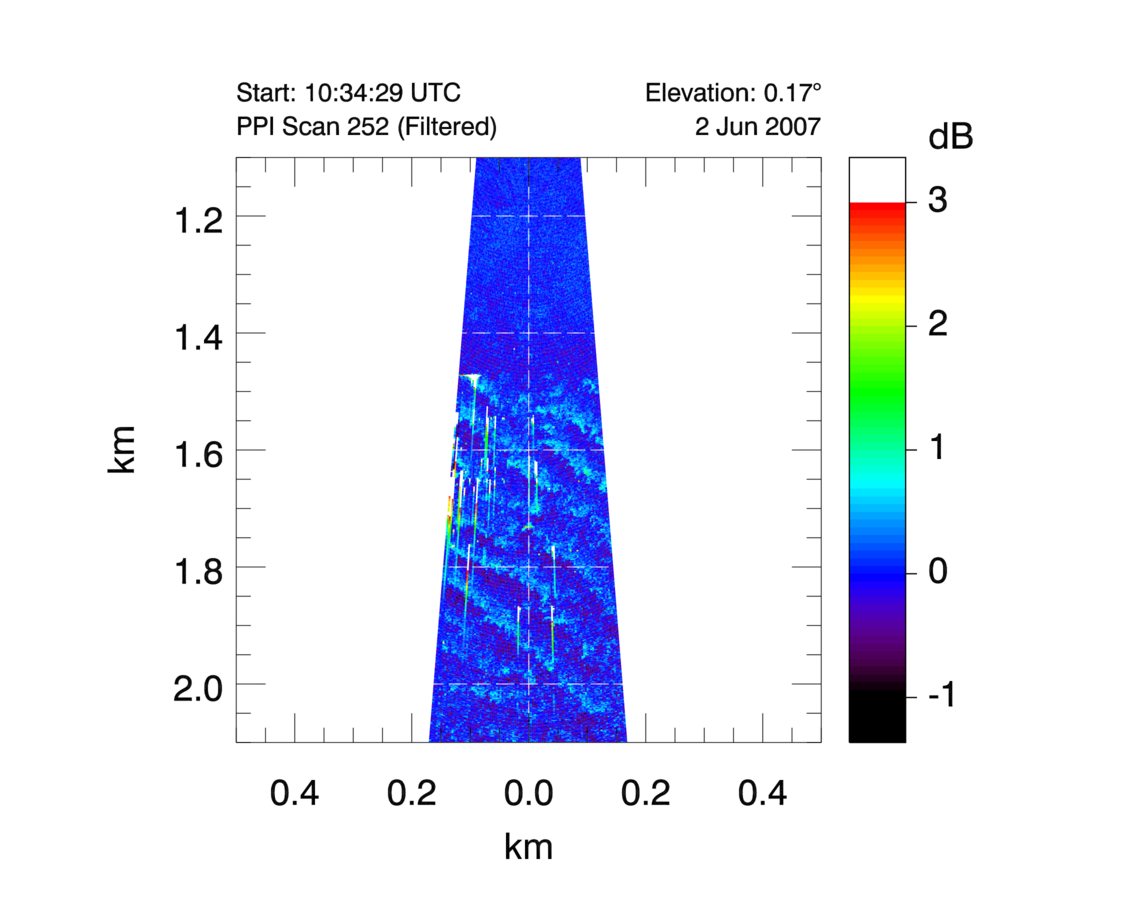
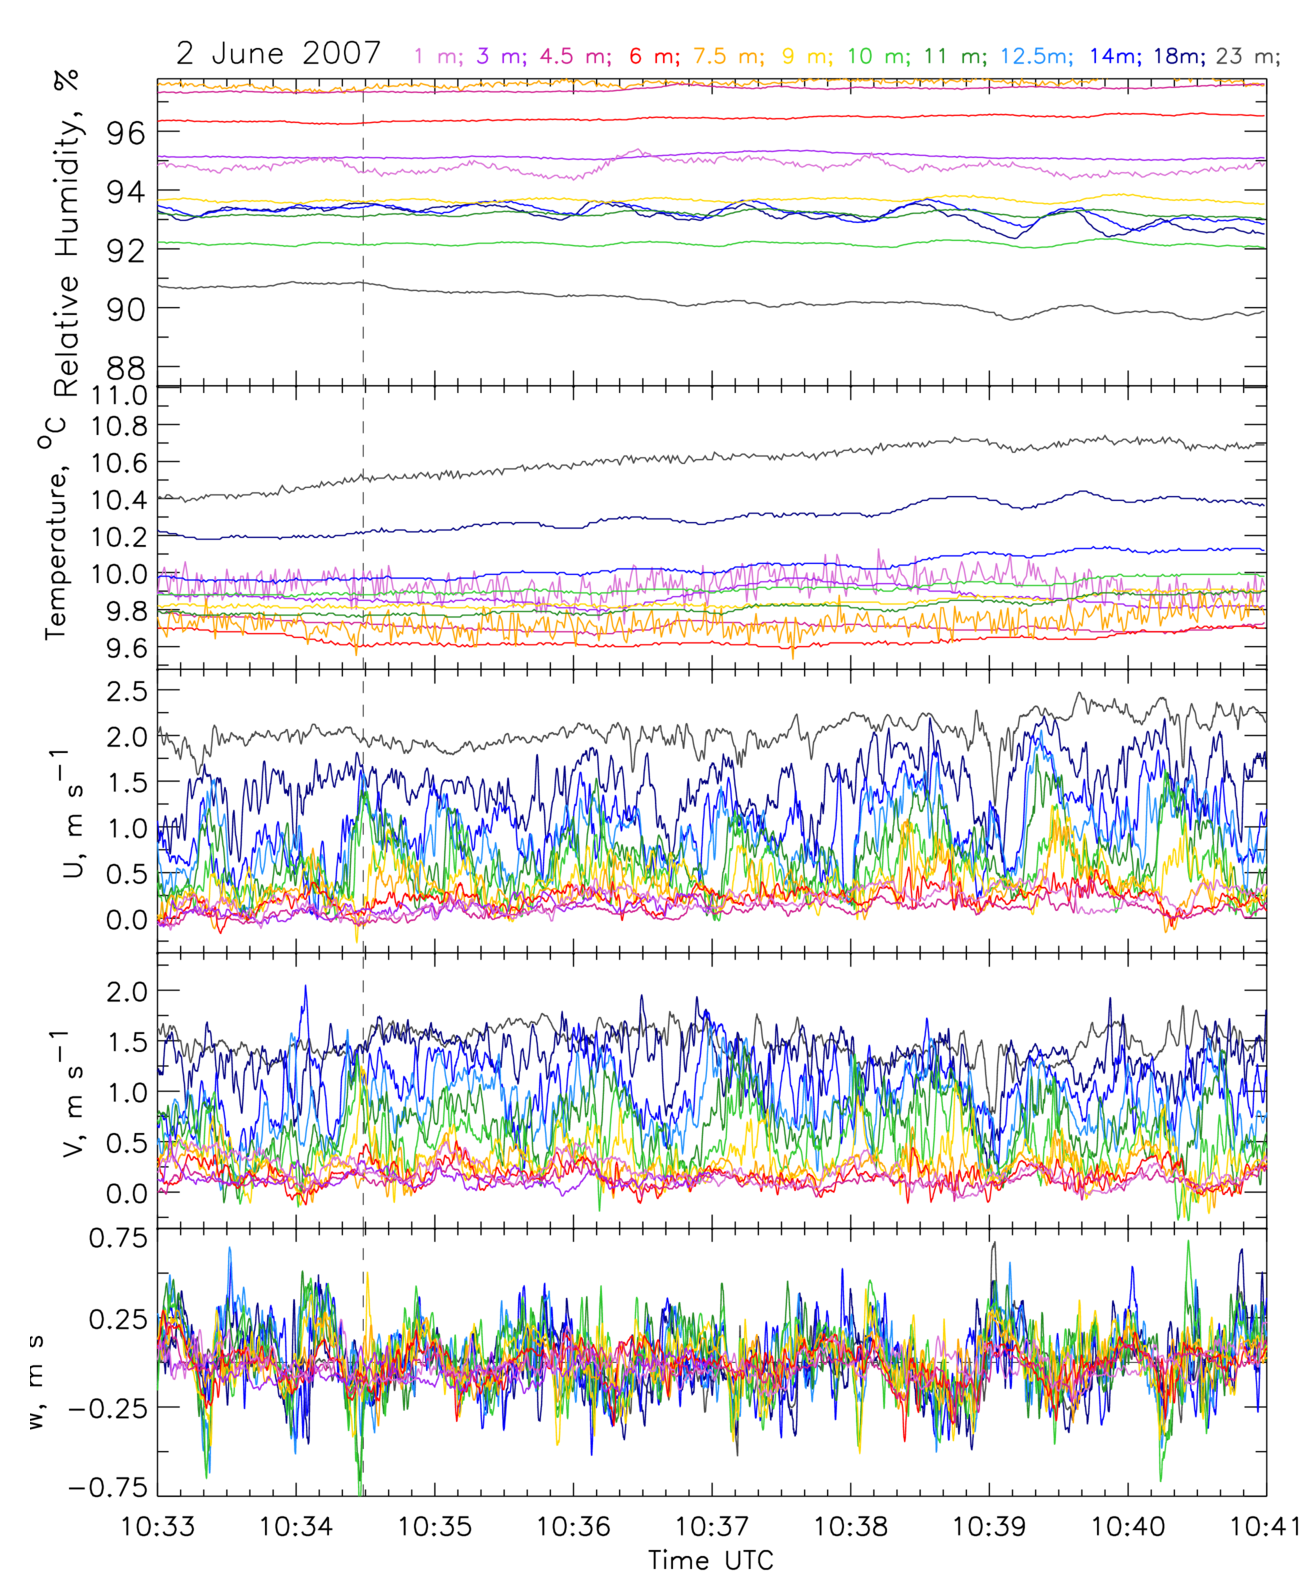
Wave Episode Example: 02 June 2007
In this wave case, the wavelength is approximately 70 meters. The duration of the episode is 6 minutes 10 seconds. The range for all time durations in the CHATS data set between 1 minute 49 seconds and 1 hour 10 minutes 37 seconds. In the episode, there are a total of 35 frames and the time between the frames is 11 seconds.
- Watch zoomed-in animation (mpeg)
- Watch zoomed-in animation (wmv)
- Watch zoomed-in animation (gif): to replay animation refresh the browser page
Further Readings:
Van Gorsel, E., I. Harman, and J.J. Finninan, 2011: Decoupling of Air Flow Above and in Plant Canopies and Gravity Waves Affect Micrometeorological Estimates of Net Scalar Exchange, AGR FOREST METEOROL., 151, 927-933.
Cava, D., U. Giostra, M. Siqueira, and G. Katul, 2004: Organised Motion and Radiative Perturbations in the Nocturnal Canopy Sublayer Above an Even-Aged Pine Forest, Bound.-Lay. Meteorol., 112, 129-157.
Lee, X., 1997: Gravity Waves in a Forest: A Linear Analysis, J. Atmos. Sci., 54, 2574-2585.
Lee, X., and A.G. Barr, 1998: Climatology of Gravity Waves in a Forest, Q. J. Roy. Meteorol. Soc., 124, 1403-1419.
Lee, X., H.H. Neumann, G. Hartog, and R.E. Mickle, 1997: Observation of Gravity Waves in a Boreal Forest, Bound.-Lay. Meteorol., 84, 383-398.