Chris Hasek
I have a bachelors in Physics and a Masters in Computer Science from Chico State. I have been working with the REAL group since 2010. In that time I have worked on a few different projects.Lidar Scan Animator (PPI/RHI)
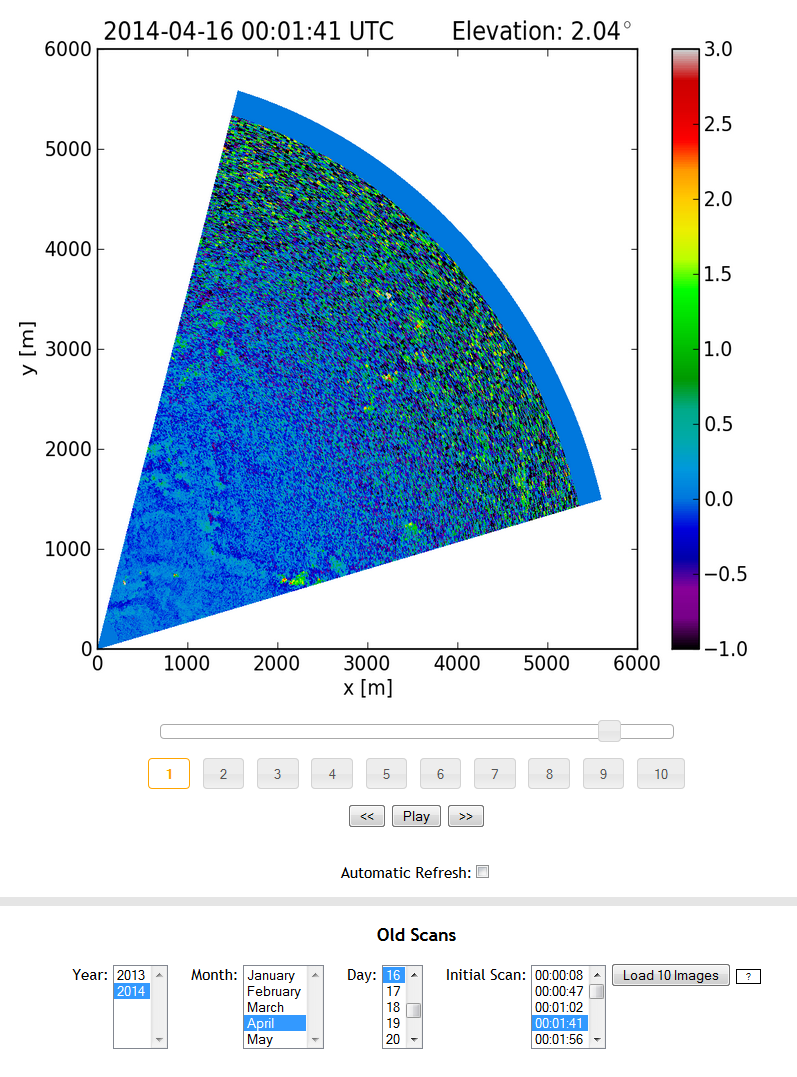
I developed a web page that animates a series of lidar raster scan images. This page allows the user to view the most recent scans collected by the lidar in near real time. We use Python behind the scenes to automatically process the data and generate the images. AJAX was used to expand on the initial concept and allow users to view archived images.
Chico Movies 2013
I extended this website to include the results from the data that we started collecting in 2013 (seen here). The goal was to duplicate the functionality of the portion of the website that displays movies from CHATS. In the process, I updated the back end code. Using php and shtml, the individual pages are dynamically generated instead of having several hundred scattered index.html files. The site now also supports automatic updates using python.
REAL Stares from CHATS
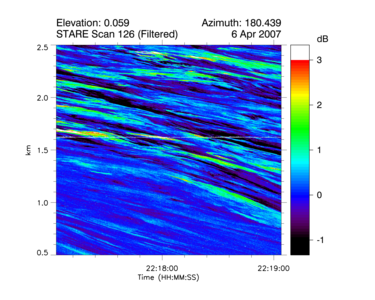
I isolated stares from the CHATS dataset and put the resulting time versus range, intensity plots (like the one below) on this website.
Stares are created by holding the lidar beam stationary, as opposed to scanning the beam horizontally or vertically. The result is an image where the abscissa is time and the ordinate is distance. You can see the stares that are currently uploaded here.
For the CHATS experiment, stares were directed so that the beam passed just meters west of the NCAR ISFF vertical tower. At some point we may generate time-series plots of the variables measured on the tower. This would allow us to investigate whether the fluctuations observed in the backscatter data are correlated with any of the in situ variables such as relative humidity or vertical velocity.
Scanning Lidar Display Software GUI
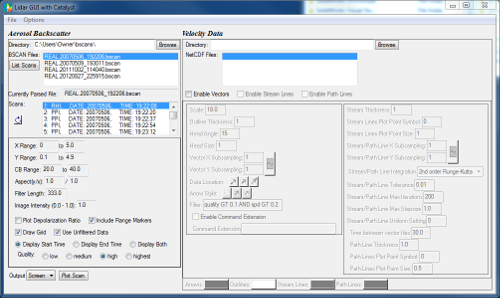
One of my first projects was to create a graphical user interface (GUI) to enable point-and-click use of scanning lidar display software. The scanning lidar display software was written by David Fanning and Dick Jackson and was used through its command line interface to create the on-line library of REAL movies and images from CHATS. To create the GUI, I borrowed from David Fanning's Catalyst library. The display software and the GUI are written in Interactive Data Language (IDL). The primary goal of the GUI was to allow users to create plots and vary parameters without having to deal with the lengthy text based commands.
Besides giving the user access to a large number of options, there are several quality of life features built into the GUI. There are default values that are automatically updated as the user switches between scan types. The default values can be easily restored on an individual basis at any time. It is easy to see which options are using their default value, and which options have been modified. It is possible to save a configuration of options, and load it again at any time. The user can control how much information about each scan is parsed and displayed. This is useful with large data files that take several minutes each to fully parse.