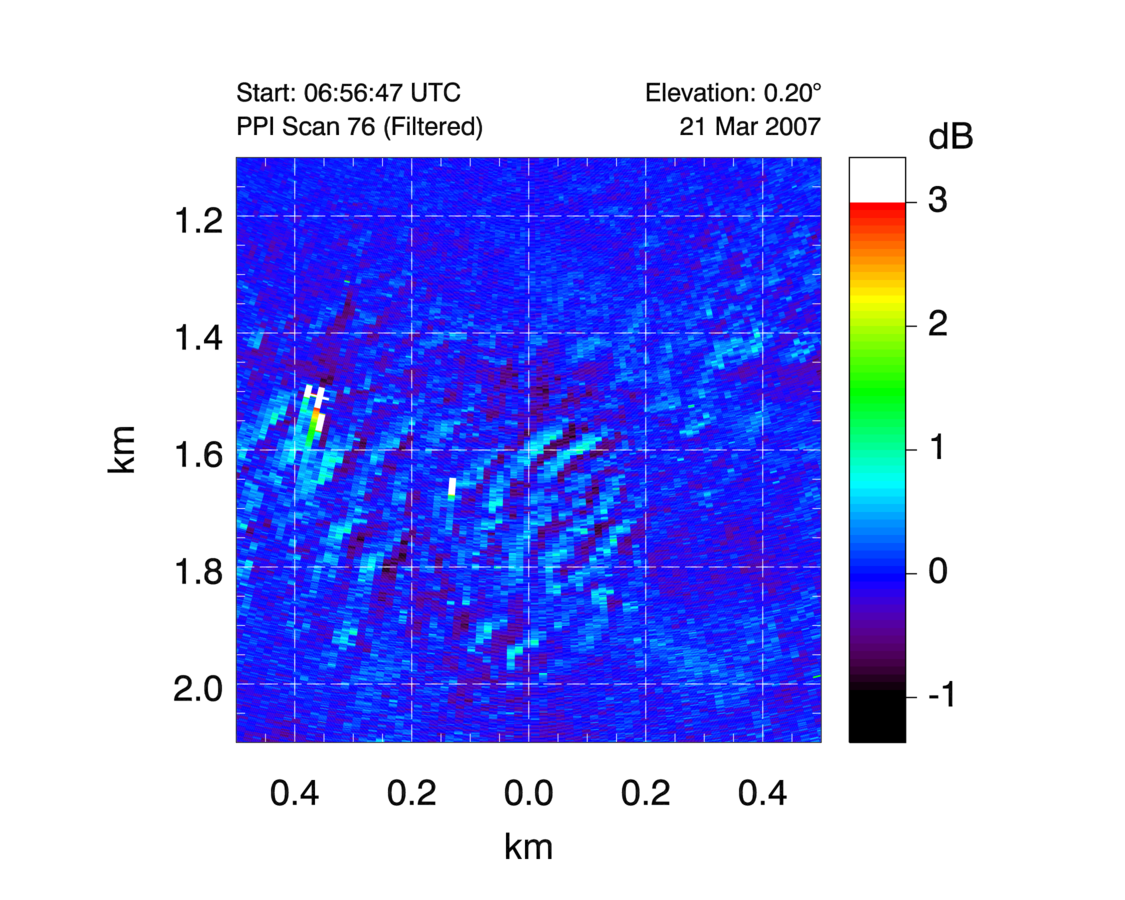
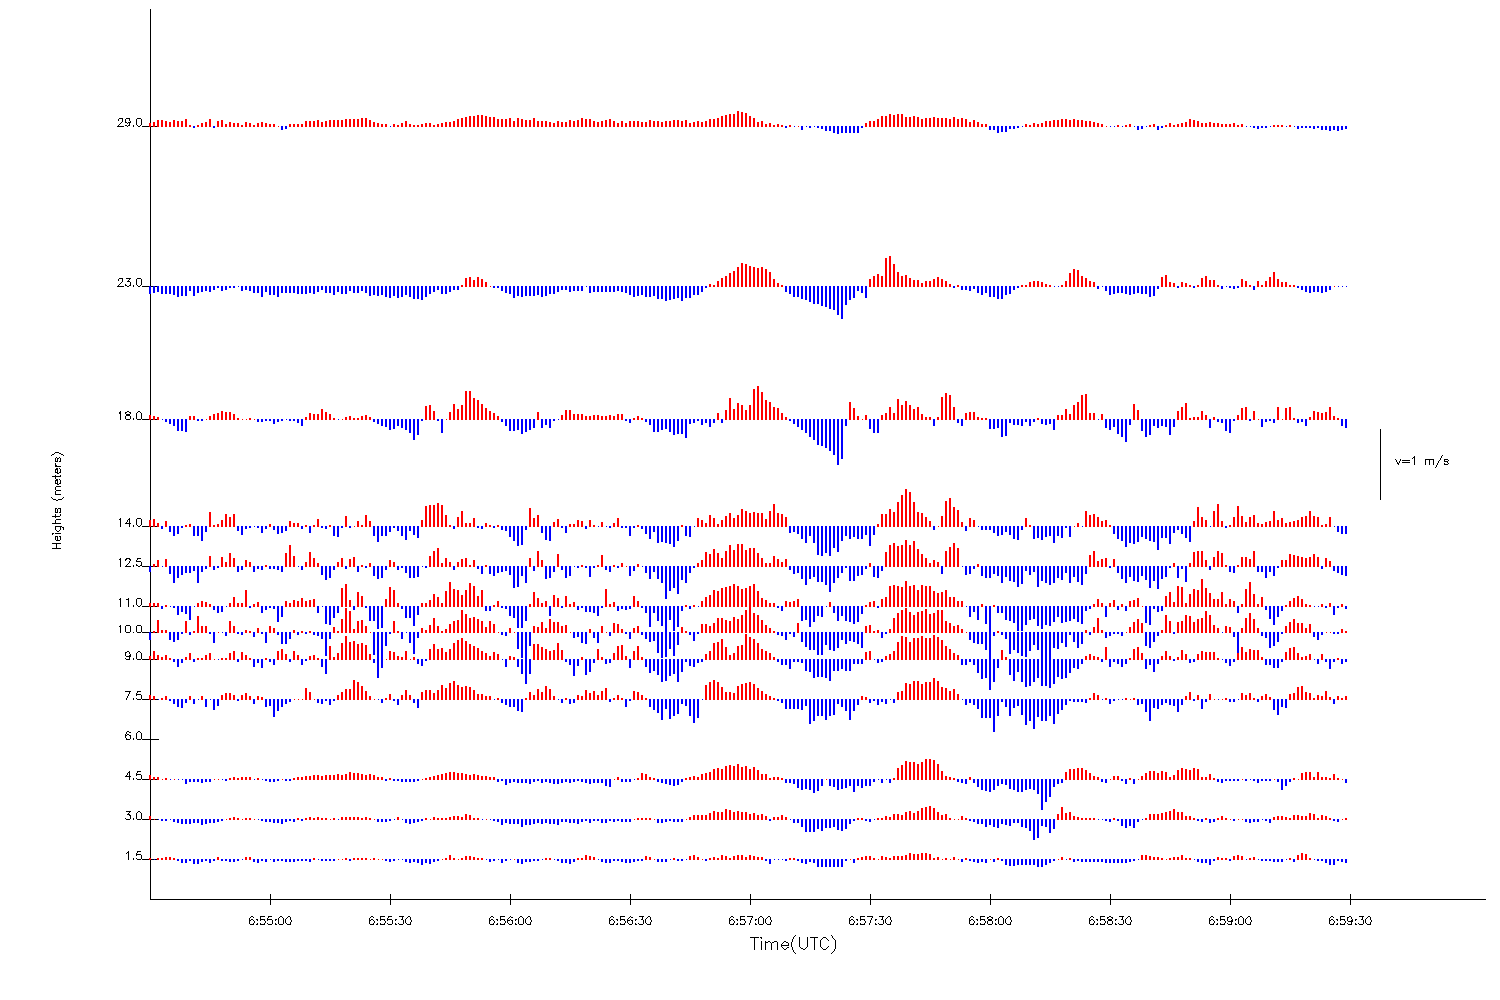
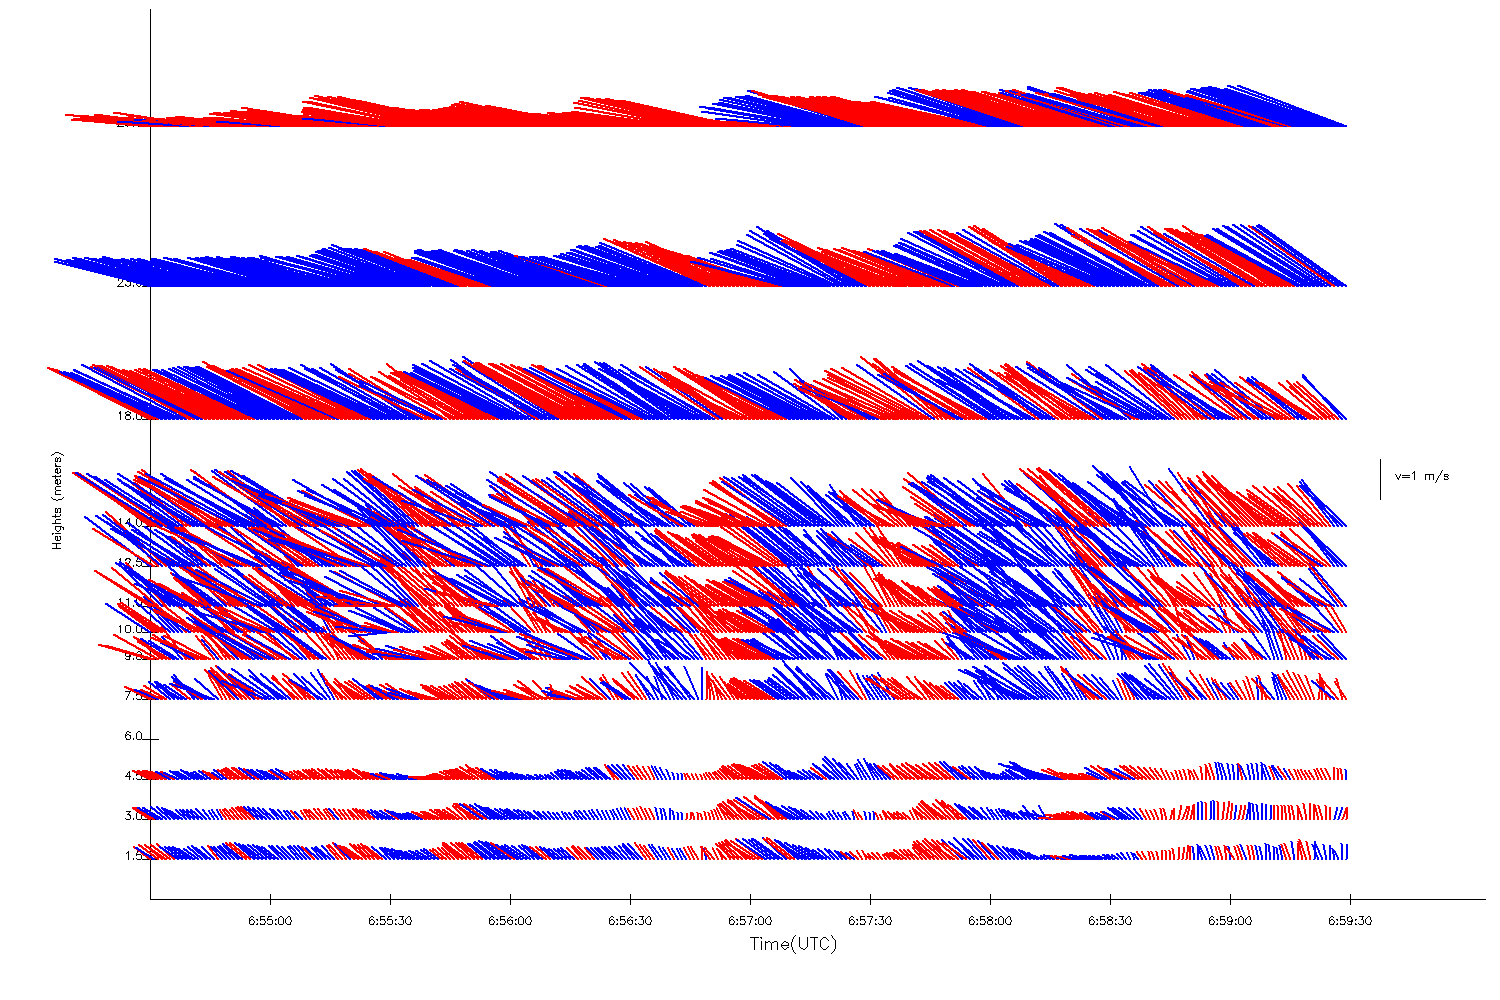
Wave Episode #2: 21 March 200706:52:45 06:57:56 UTC |
||
|---|---|---|
 |
|
 |
| (5 min span) |
(5 min span) |
|
 |
 |
 |
| (5 min span) |
(5 min span) |
|
 |
 |
|
Wave Episode #2: 21 March 200706:52:45 06:57:56 UTC |
||
|---|---|---|
| |
|
|
| (5 min span) |
(5 min span) |
|
|
|
|
| (5 min span) |
(5 min span) |
|
|
|
|